Climate policy/Policy issues: Difference between revisions
Jump to navigation
Jump to search
No edit summary |
Oostenrijr (talk | contribs) No edit summary |
||
| Line 1: | Line 1: | ||
{{ComponentPolicyIssueTemplate | {{ComponentPolicyIssueTemplate | ||
|Reference=Den Elzen et al., 2007; Den Elzen and van Vuuren, 2007; Van Vuuren et al., 2011a; Van Vuuren et al., 2012; European Commission, 2010; Den Elzen et al., 2012b; Den Elzen et al., 2011b; UNEP, 2012; Hof et al., 2013; Höhne et al., 2012; Roelfsema et al., 2013; Roelfsema et al., 2014; Den Elzen and Höhne, 2010; Den Elzen et al., 2012a; Hof et al., 2012; Mendoza Beltrán et al., 2011; Hof et al., 2011; Hof et al., 2008; Hof et al., 2010; Den Elzen et al., 2012c; Van Vliet et al., 2012; | |Reference=Den Elzen et al., 2007; Den Elzen and van Vuuren, 2007; Van Vuuren et al., 2011a; Van Vuuren et al., 2012; European Commission, 2010; Den Elzen et al., 2012b; Den Elzen et al., 2011b; UNEP, 2012; Hof et al., 2013; Höhne et al., 2012; Roelfsema et al., 2013; Roelfsema et al., 2014; Den Elzen and Höhne, 2010; Den Elzen et al., 2012a; Hof et al., 2012; Mendoza Beltrán et al., 2011; Hof et al., 2011; Hof et al., 2008; Hof et al., 2010; Den Elzen et al., 2012c; Van Vliet et al., 2012; | ||
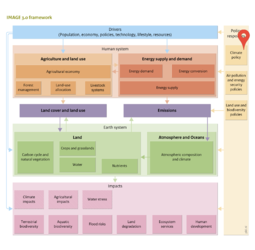
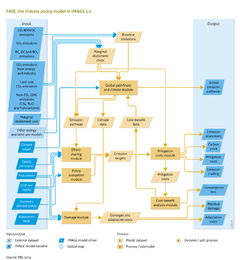
|Description=[[FAIR model|FAIR]] can be used to analyse baseline developments, such as expected climate change damage. However, more often baseline developments are explored using the larger IMAGE framework, and the FAIR model receives this information as input for policy analysis. | |Description=[[FAIR model|FAIR]] can be used to analyse baseline developments, such as expected climate change damage. However, more often baseline developments are explored using the larger IMAGE framework, and the FAIR model receives this information as input for policy analysis. | ||
| Line 21: | Line 21: | ||
The FAIR Policy Evaluation module has been used in determining emission reductions resulting from pledges made for 2020 ([[Den Elzen et al., 2012c]]). In 2011, Brazil presented a new, higher estimate for national business-as-usual ({{abbrTemplate|BAU}}) emissions, against which a 36 to 39% reduction pledge was made. The total pledge for all greenhouse gas emissions including emissions from deforestation was a reduction of 20 to 24% compared to the PBL/IIASA BAU emission projections. This reduction is substantially lower than pledged by Brazil from national {{abbrTemplate|BAU}} projections . | The FAIR Policy Evaluation module has been used in determining emission reductions resulting from pledges made for 2020 ([[Den Elzen et al., 2012c]]). In 2011, Brazil presented a new, higher estimate for national business-as-usual ({{abbrTemplate|BAU}}) emissions, against which a 36 to 39% reduction pledge was made. The total pledge for all greenhouse gas emissions including emissions from deforestation was a reduction of 20 to 24% compared to the PBL/IIASA BAU emission projections. This reduction is substantially lower than pledged by Brazil from national {{abbrTemplate|BAU}} projections . | ||
As shown in | As shown in the figure below, all reductions result from reduced emissions from deforestation (REDD). The contributions from {{abbrTemplate|REDD}} projects (about 560 MtCO2) are expected to exceed or match the required total reduction in all greenhouse gas emissions of 470 and 570 Mt CO2eq for the 36% and 39% reduction pledge scenarios. | ||
|Example=The Global Pathfinder module was used to determine what the pledges for 2020 imply for global emission pathways consistent with meeting the 2 °C target ([[Van Vliet et al., 2012]]). The main findings were as follows (see also | |Example=The Global Pathfinder module was used to determine what the pledges for 2020 imply for global emission pathways consistent with meeting the 2 °C target ([[Van Vliet et al., 2012]]). The main findings were as follows (see also the figure below): | ||
* The global 2020 emission level resulting from implementation of the Copenhagen Accord pledges exceeds those of least-cost pathways that achieve a 2 °C target; | * The global 2020 emission level resulting from implementation of the Copenhagen Accord pledges exceeds those of least-cost pathways that achieve a 2 °C target; | ||
* Slightly postponing mitigation action (potential Copenhagen scenario) compared to the least-cost scenario seems technically feasible but at higher cumulative discounted mitigation costs; | * Slightly postponing mitigation action (potential Copenhagen scenario) compared to the least-cost scenario seems technically feasible but at higher cumulative discounted mitigation costs; | ||
Revision as of 09:06, 24 June 2014
Parts of Climate policy/Policy issues