Energy conversion/Policy issues: Difference between revisions
Jump to navigation
Jump to search
No edit summary |
No edit summary |
||
| Line 1: | Line 1: | ||
{{ComponentPolicyIssueTemplate | {{ComponentPolicyIssueTemplate | ||
|Reference=Kruyt et al., 2009; PBL, 2012; | |Reference=Kruyt et al., 2009; PBL, 2012; | ||
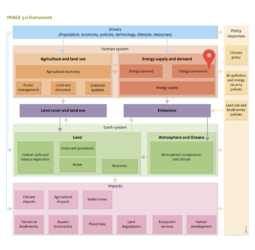
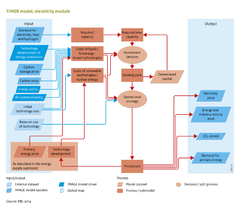
|Description=The energy conversion module may be used to generate scenarios with and without climate policy. The results for a typical baseline scenario are shown in Figure below. At present, coal is the main feedstock for power generation globally. In high-income regions, coal faces competition from natural gas, but in emerging economies, such as China and India, coal is still by far the largest resource used. The baseline scenario projects coal use to expand. The underlying reasons for this expansion are the rapid increase in electricity use in emerging economies, and the stronger price increases for natural gas than for coal. The latter, clearly, also depends on the uncertainty in future natural gas supply. On a global scale, wind power and biomass-fired power plants are rapidly expanding in total capacity. | |Description=The energy conversion module may be used to generate scenarios with and without climate policy. The results for a typical baseline scenario are shown in Figure below. At present, coal is the main feedstock for power generation globally. In high-income regions, coal faces competition from natural gas, but in emerging economies, such as China and India, coal is still by far the largest resource used. The baseline scenario projects coal use to expand. The underlying reasons for this expansion are the rapid increase in electricity use in emerging economies, and the stronger price increases for natural gas than for coal. The latter, clearly, also depends on the uncertainty in future natural gas supply. On a global scale, wind power and biomass-fired power plants are rapidly expanding in total capacity. | ||
|Example=Model analyses show that a high proportion of emission reductions would be achieved through supply side changes.The | |Example= IMAGE model simulations include several types of policy interventions that may influence electricity and hydrogen production: | ||
* Carbon tax: this measure is usually implemented on an economy-wide scale and has strong influence on investment and operational strategies in the power system. Because prices are relatively low, there are several competitive power alternatives, and power system choices are usually rather objectively. | |||
* An imposed minimum or maximum share per energy source - renewable energy, CCS technology, nuclear power and other forms of power generation. This would directly influence the capacity installed for each option. | |||
* Promoting the use of electricity and hydrogen on end-user level. With the high flexibility in the choice of feedstock in these systems, large proportions of electricity and hydrogen use in final energy would increase the ability of the total system to reduce greenhouse gas emissions. | |||
The exclusion of certain power-generation options for environmental and/or security reasons ([[Kruyt et al., 2009]]). | |||
Model analyses show that a high proportion of emission reductions would be achieved through supply side changes. The capacity for different supply-side options under the baseline scenario and various pathways consistent with the 2 °C climate change target are presented in Figure below. | |||
The proportion of unabated fossil fuel use is still 80% of total primary energy under the baseline scenario (see above) but by 2050, this would need to be around 15 to 20% according to the 2 °C scenarios. The results show that pathways can be identified in which the remaining energy comes from bioenergy, other renewable energy, nuclear energy, and from fossil-fuel energy combined with {{abbrTemplate|CCS}}. There is flexibility in the choice of these options, as illustrated in the Decentralised Solutions and Global Technology pathways with different patterns for nuclear power and renewable energy. In the IMAGE framework under nearly all scenarios, the combination of bioenergy and CCS, and CCS in general, plays a critical role in achieving the 2 °C target. | |||
}} | }} | ||
Revision as of 14:28, 22 May 2014
Parts of Energy conversion/Policy issues
| Component is implemented in: |
|
| Related IMAGE components |
| Projects/Applications |
| Models/Databases |
| Key publications |
| References |