Energy conversion/Policy issues: Difference between revisions
No edit summary |
Oostenrijr (talk | contribs) No edit summary |
||
| (12 intermediate revisions by 6 users not shown) | |||
| Line 1: | Line 1: | ||
{{ | {{ComponentPolicyIssueTemplate | ||
|Reference=Kruyt et al., 2009; PBL, 2012; | |||
|Reference=Kruyt et al., 2009 | |||
}} | }} | ||
<div class="page_standard"> | |||
==Baseline developments== | |||
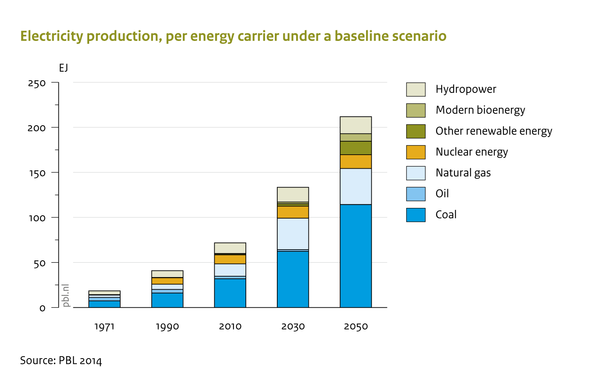
The energy conversion module may be used to generate scenarios with and without climate policy. The results for a typical baseline scenario are shown in the figure below. At present, coal is the main feedstock for power generation globally. In high-income regions, coal faces competition from natural gas, but in emerging economies, such as China and India, coal is still by far the largest resource used. The baseline scenario projects coal use to expand. The underlying reasons for this expansion are the rapid increase in electricity use in emerging economies, and the stronger price increases for natural gas than for coal. The latter, clearly, also depends on the uncertainty in future natural gas supply. On a global scale, wind power and biomass-fired power plants are rapidly expanding in total capacity. | |||
{{DisplayPolicyInterventionFigureTemplate|{{#titleparts: {{PAGENAME}}|1}}|Baseline figure}} | |||
==Policy interventions== | |||
IMAGE model simulations include several types of policy interventions that may influence electricity and hydrogen production: | |||
* Carbon tax: this measure is usually implemented on an economy-wide scale and has strong influence on investment and operational strategies in the power system. Because prices are relatively low, there are several competitive power alternatives, and power system choices are usually rather objectively. | |||
* An imposed minimum or maximum share per energy source - renewable energy, CCS technology, nuclear power and other forms of power generation. This would directly influence the capacity installed for each option. | |||
* Promoting the use of electricity and hydrogen on end-user level. With the high flexibility in the choice of feedstock in these systems, large proportions of electricity and hydrogen use in final energy would increase the ability of the total system to reduce greenhouse gas emissions. | |||
* The exclusion of certain power-generation options for environmental and/or security reasons ([[Kruyt et al., 2009]]). | |||
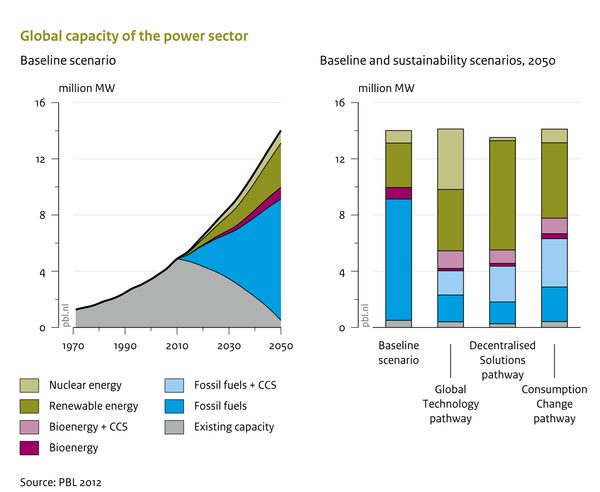
Model analyses show that a high proportion of emission reductions would be achieved through supply side changes. The capacity for different supply-side options under the baseline scenario and various pathways consistent with the 2 °C climate change target are presented in the figure below. | |||
The proportion of unabated fossil fuel use is still 80% of total primary energy under the baseline scenario (see above) but by 2050, this would need to be around 15 to 20% according to the 2 °C scenarios. The results show that pathways can be identified in which the remaining energy comes from bioenergy, other renewable energy, nuclear energy, and from fossil-fuel energy combined with {{abbrTemplate|CCS}}. There is flexibility in the choice of these options, as illustrated in the Decentralised Solutions and Global Technology pathways with different patterns for nuclear power and renewable energy. In the IMAGE framework under nearly all mitigation scenarios, the combination of bioenergy and CCS plays a critical role in achieving the 2 °C target. | |||
{{DisplayPolicyInterventionFigureTemplate|{{#titleparts: {{PAGENAME}}|1}}|Policy intervention figure}} | |||
{{PIEffectOnComponentTemplate }} | |||
</div> | |||
Latest revision as of 16:42, 15 November 2018
Parts of Energy conversion/Policy issues
| Component is implemented in: |
|
| Related IMAGE components |
| Projects/Applications |
| Models/Databases |
| Key publications |
| References |
Baseline developments
The energy conversion module may be used to generate scenarios with and without climate policy. The results for a typical baseline scenario are shown in the figure below. At present, coal is the main feedstock for power generation globally. In high-income regions, coal faces competition from natural gas, but in emerging economies, such as China and India, coal is still by far the largest resource used. The baseline scenario projects coal use to expand. The underlying reasons for this expansion are the rapid increase in electricity use in emerging economies, and the stronger price increases for natural gas than for coal. The latter, clearly, also depends on the uncertainty in future natural gas supply. On a global scale, wind power and biomass-fired power plants are rapidly expanding in total capacity.
Policy interventions
IMAGE model simulations include several types of policy interventions that may influence electricity and hydrogen production:
- Carbon tax: this measure is usually implemented on an economy-wide scale and has strong influence on investment and operational strategies in the power system. Because prices are relatively low, there are several competitive power alternatives, and power system choices are usually rather objectively.
- An imposed minimum or maximum share per energy source - renewable energy, CCS technology, nuclear power and other forms of power generation. This would directly influence the capacity installed for each option.
- Promoting the use of electricity and hydrogen on end-user level. With the high flexibility in the choice of feedstock in these systems, large proportions of electricity and hydrogen use in final energy would increase the ability of the total system to reduce greenhouse gas emissions.
- The exclusion of certain power-generation options for environmental and/or security reasons (Kruyt et al., 2009).
Model analyses show that a high proportion of emission reductions would be achieved through supply side changes. The capacity for different supply-side options under the baseline scenario and various pathways consistent with the 2 °C climate change target are presented in the figure below.
The proportion of unabated fossil fuel use is still 80% of total primary energy under the baseline scenario (see above) but by 2050, this would need to be around 15 to 20% according to the 2 °C scenarios. The results show that pathways can be identified in which the remaining energy comes from bioenergy, other renewable energy, nuclear energy, and from fossil-fuel energy combined with CCS. There is flexibility in the choice of these options, as illustrated in the Decentralised Solutions and Global Technology pathways with different patterns for nuclear power and renewable energy. In the IMAGE framework under nearly all mitigation scenarios, the combination of bioenergy and CCS plays a critical role in achieving the 2 °C target.
Effects of policy interventions on this component
| Policy intervention | Description | Effect |
|---|---|---|
| Capacity targets (*) | It is possible to prescribe the shares of renewables, CCS technology, nuclear power and other forms of generation capacity. This measure influences the amount of capacity installed of the technology chosen. | Manually changing the generation capacity will result in a transition towards using more or less capacity of the selected generation type. |
| Carbon tax (*) | A tax on carbon leads to higher prices for carbon intensive fuels (such as fossil fuels), making low-carbon alternatives more attractive. | A carbon tax will induce a transition from carbon intensive fuel to carbon low fuels. Since hydrogen and electricity are well suited for carrying carbon low energy, the production of hydrogen and electricity could increase. |
| Change market shares of fuel types | Exogenously set the market shares of certain fuel types. This can be done for specific analyses or scenarios to explore the broader implications of increasing the use of, for instance, biofuels, electricity or hydrogen and reflects the impact of fuel targets. (Reference:: Van Ruijven et al., 2007) | An interference with the share of fuel types, results in a change of the market share of the selected fuel types to the predetermined values. This again results in less conversion capacity of the selected fuel type. |
| Change the use of electricity and hydrogen (*) | It is possible to promote the use of electricity and hydrogen at the end-use level. | This policy intervention will result in more hydrogen or electricity production and generation capacity. |
| Excluding certain technologies (*) | Certain energy technology options can be excluded in the model for environmental, societal, and/or security reasons. (Reference:: Kruyt et al., 2009) | This policy intervention will result in the exclusion of the selected technologies. This is likely to result in an increased use of alternative technologies. |
| Improving energy efficiency | Exogenously set improvement in efficiency. Such improvements can be introduced for the submodels that focus on particular technologies, for example, in transport, heavy industry and households submodels. | Efficiency improvements result in less energy input at an equal energy output of conversion technologies. This results in a lower need for conversion capacity. |
| Production targets for energy technologies | Production targets for energy technologies can be set to force technologies through a learning curve. | Production targets force a conversion technology to convert energy, even though this is not economically attractive. If the learning rate of that technology depends on the amount of converted energy, the learning rate will increase. |
| Restrictions on fuel trade | As part of energy security policies, fuel trade between different regions can be blocked. | Less fuel trade will result in a change in fuel prices and availability. As a result, the amount of conversion capacity can increase or decrease. |