File:Precipitation grid digraph inputvariable dot.png
Jump to navigation
Jump to search

Size of this preview: 799 × 121 pixels. Other resolution: 864 × 131 pixels.
Original file (864 × 131 pixels, file size: 17 KB, MIME type: image/png)
ImageMap
When including this image in a wiki page, use the following mark-up to enable links:
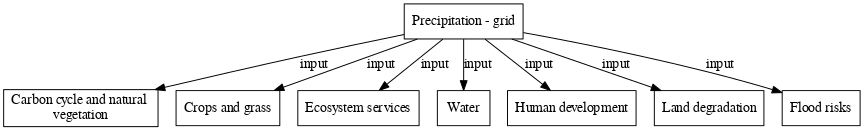
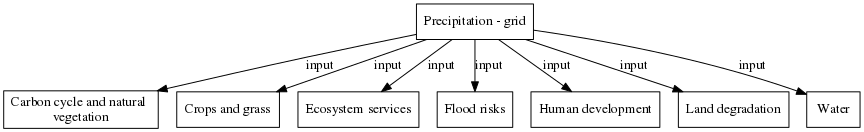
<imagemap>
File:Precipitation___grid_digraph_inputvariable_dot.png
rect 416 4 533 39 [[Precipitation - grid]]
rect 3 91 158 128 [[Carbon cycle and natural vegetation]]
rect 177 92 279 127 [[Crops and grass]]
rect 298 92 419 127 [[Ecosystem services]]
rect 437 92 512 127 [[Flood risks]]
rect 531 92 660 127 [[Human development]]
rect 678 92 789 127 [[Land degradation]]
rect 807 92 860 127 [[Water]]</imagemap>
See ImageMap for more information.
File history
Click on a date/time to view the file as it appeared at that time.
| Date/Time | Thumbnail | Dimensions | User | Comment | |
|---|---|---|---|---|---|
| current | 15:36, 20 March 2020 | 864 × 131 (17 KB) | Graphviz (talk | contribs) | ||
| 14:53, 20 March 2020 | 173 × 59 (2 KB) | Graphviz (talk | contribs) | |||
| 16:54, 19 March 2020 | 864 × 131 (17 KB) | Oostenrijr (talk | contribs) | |||
| 16:54, 19 March 2020 | 173 × 59 (2 KB) | Oostenrijr (talk | contribs) | |||
| 19:10, 10 March 2020 | 864 × 131 (17 KB) | Oostenrijr (talk | contribs) | |||
| 19:09, 10 March 2020 | 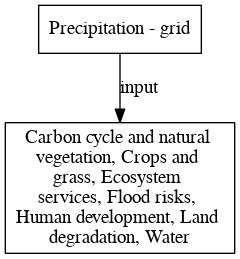 | 240 × 259 (12 KB) | Oostenrijr (talk | contribs) | ||
| 11:40, 19 July 2017 | 864 × 132 (17 KB) | Oostenrijr (talk | contribs) | generated by the GraphViz extension from the Precipitation - grid page |
You cannot overwrite this file.
File usage
There are no pages that use this file.