Land degradation/Description: Difference between revisions
Jump to navigation
Jump to search
No edit summary |
No edit summary |
||
| Line 32: | Line 32: | ||
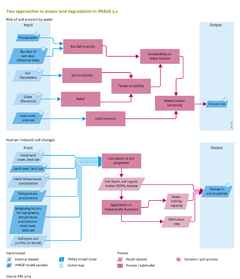
Comparison of the calculation above and the GLASOD degradation status maps by [[Oldeman et al., 1991|Oldeman et al. (1991)]] shows maximum correspondence with use of the classification in Table 7.5.2. This classification can be used as a guide in analysing the water erosion sensitivity indicator. | Comparison of the calculation above and the GLASOD degradation status maps by [[Oldeman et al., 1991|Oldeman et al. (1991)]] shows maximum correspondence with use of the classification in Table 7.5.2. This classification can be used as a guide in analysing the water erosion sensitivity indicator. | ||
{| | |||
|Orange | |||
|Apple | |||
|- | |||
|Bread | |||
|Pie | |||
|- | |||
|Butter | |||
|Ice cream | |||
|} | |||
{| | {| | ||
Revision as of 12:34, 18 May 2014
Parts of Land degradation/Description
| Component is implemented in: |
|
| Related IMAGE components |
| Projects/Applications |
| Models/Databases |
| Key publications |
| References |