Land degradation/Description: Difference between revisions
Jump to navigation
Jump to search
No edit summary |
No edit summary |
||
| Line 32: | Line 32: | ||
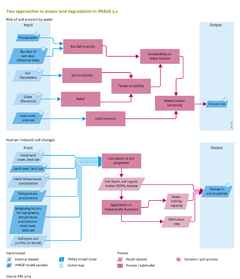
Comparison of the calculation above and the GLASOD degradation status maps by [[Oldeman et al., 1991|Oldeman et al. (1991)]] shows maximum correspondence with use of the classification in Table 7.5.2. This classification can be used as a guide in analysing the water erosion sensitivity indicator. | Comparison of the calculation above and the GLASOD degradation status maps by [[Oldeman et al., 1991|Oldeman et al. (1991)]] shows maximum correspondence with use of the classification in Table 7.5.2. This classification can be used as a guide in analysing the water erosion sensitivity indicator. | ||
'''Classification of the Water Erosion Sensitivity Index''' | |||
<table> | <table> | ||
<tr> | <tr> | ||
<th>Water Erosion Sensitivity Index</th> | <th>Water Erosion Sensitivity Index</th> | ||
| Line 55: | Line 56: | ||
</tr> | </tr> | ||
</table> | </table> | ||
==B. Human-induced soil changes== | |||
Soil degradation is mostly reflected in changes in soil properties, such as soil depth, soil organic matter ({{abbrTemplate|SOM}}) content, and texture. Land cover and land use drive changes in soil properties. Land cover protects the soil against wind and water erosion, and provides organic matter to the soil. Land use tends to remove part of the biomass with harvested crops and residues and may increase mineralisation of SOM through tillage. | |||
An empirical model denominated S-World has been developed that relates change in soil properties to topography, climate (average annual temperature and total annual precipitation), land management and land use, and land cover (as vegetation cover) ([[Stoorvogel, 2014]]; [[Stoorvogel et al., in preparation]]). The following soil properties are considered: | |||
* topsoil depth, | |||
* soil depth, | |||
* soil organic matter in the topsoil and subsoil , and | |||
* soil texture (sand and clay content). | |||
S-World is based on the global Harmonised World Soil Database ([[HWSD database|HWSD]]; ([[FAO et al., 2009]]) and the [[WISE database|WISE soil profile database]] ([[Batjes, 2009]]). The compound mapping units in HWSD were disaggregated using detailed terrain information, so that each grid cell could be linked to a unique soil type described in the WISE database. For each soil type, ranges for the main soil characteristics described above were assessed on the basis of the WISE soil profiles. The range of variable, i.e., soil property v for every soil type s is subsequently defined as: | |||
: [v<sub>ls</sub>..v<sub>hs</sub>] | |||
in which | |||
:v<sub>ls</sub> corresponds to the 1<sup>st</sup> decile and | |||
: v<sub>hs</sub> to the 9<sup>th</sup> decile. | |||
S-World downscales each soil property v based on 5 landscape properties or explanatory factors [''p_1,p_2… p_5'']. These explanatory factors are: | |||
: temperature, | |||
: precipitation, | |||
: slope, | |||
: land management, and | |||
: land cover. | |||
The land management is set to | |||
* 1.0 for cropland, | |||
* 0.5 for mosaics of cropland and pasture or natural vegetation, | |||
* 0.3 for pasture, and | |||
* 0.0 for natural vegetation. | |||
Land cover is characterised by a remotely sensed NDVI map. The soil property v at location x with soil s is estimated as | |||
( v_x ) ̂=v_ls+w_x*(v_hs- v_ls) | |||
with w_x being a weight w∈ [0..1] that determines where v is in the range [v_ls..v_hs ]. Different explanatory factors represented by the landscape properties determine w. The weight at location x is calculated as w_x= ∑_(p=1)^5▒w_px . The weight w_px for landscape property p is calculated as: | |||
:c_pv≥0: w_px=c_pv* ((p_x-p_ls ))/((p_hs- p_ls ) ) | |||
:c_pv<0: w_px=-c_pv* ((p_hs-p_x ))/((p_hs- p_ls ) ) | |||
In which c_pv is a constant that indicates the relative importance of the landscape property p for a soil property v. The sign of c_pv indicates whether there is a positive or negative relationship between the landscape property and the soil property. When ∑_(p=1)^n▒〖|c_(pv ) |=1〗, the w∈ [0..1] and all values in the range [v_ls..v_hs ] are possible based on the landscape properties. Although in practice c is specific for each landscape property, soil type, and soil property, data are lacking to estimate c at that level of specificity. Therefore the model assumes that c is constant per soil and landscape property, or, in other words, the relative impact of landscape properties on a specific soil property is assumed to be constant over the different soil types. | |||
The soil properties are estimated based on land management and land use. This allows for the estimation of soil properties under pristine conditions. For future years, the NDVI map is changed as a function of land use, forest management and assumptions on degradation. To assess pristine conditions, soil properties are calculated with land use set at natural, and land cover represented by the NDVI under pristine conditions. | |||
With this procedure, a change in soil properties (topsoil depth, soil depth, SOM in topsoil and subsoil, and soil texture) can be calculated as a result of land use and land cover. Subsequently, additional soil characteristics, such as water holding capacity and water infiltration rate, can be derived from these soil property values by using pedo-transfer functions (Van Beek, 2012). These soil characteristics can be used in other models in the IMAGE framework, such as LPJmL (Section 6.1) and GLOFRIS (Section 7.4), as alternative input to assess the consequences of historical or future land degradation. | |||
}} | }} | ||
Revision as of 12:54, 18 May 2014
Parts of Land degradation/Description
| Component is implemented in: |
|
| Related IMAGE components |
| Projects/Applications |
| Models/Databases |
| Key publications |
| References |