Flood risks/Description: Difference between revisions
Jump to navigation
Jump to search
No edit summary |
No edit summary |
||
| Line 24: | Line 24: | ||
===Flood risk=== | ===Flood risk=== | ||
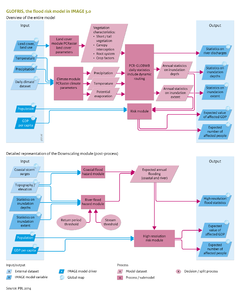
After the high-resolution flood hazard maps have been established, the annual extreme values can be combined to form average annual flood hazard maps and flood risk maps. At this scale, more local detail can be added about cropland locations, high-resolution maps on population and GDP and other exposure data of interest. The resulting flood hazard maps can be combined with these high-resolution maps and, if possible, in more localised damage models. | After the high-resolution flood hazard maps have been established, the annual extreme values can be combined to form average annual flood hazard maps and flood risk maps. At this scale, more local detail can be added about cropland locations, high-resolution maps on population and GDP and other exposure data of interest. The resulting flood hazard maps can be combined with these high-resolution maps and, if possible, in more localised damage models. | ||
More information about GLOFRIS, its underlying models and methods, and the downscaling module is available in [[Winsemius et al., 2012]] and [[Ward et al., 2013]]. | More information about GLOFRIS, its underlying models and methods, and the downscaling module is available in [[Winsemius et al., 2012]] and [[Ward et al., 2013]]. | ||
}} | }} | ||
Revision as of 11:24, 18 May 2014
Parts of Flood risks/Description
| Component is implemented in: |
|
| Related IMAGE components |
| Models/Databases |
| Key publications |
| References |