Policy intervention figure Agricultural economy: Difference between revisions
Jump to navigation
Jump to search

Oostenrijr (talk | contribs) m (Oostenrijr moved page Policy intervention figure AEF to Policy intervention figure Agricultural economy without leaving a redirect: Text replace - "AEF" to "Agricultural economy") |
Dafnomilii (talk | contribs) No edit summary |
||
| Line 1: | Line 1: | ||
{{FigureTemplate | {{FigureTemplate | ||
|Figure= | |Figure=Gcb14887-fig-0006-m.jpg | ||
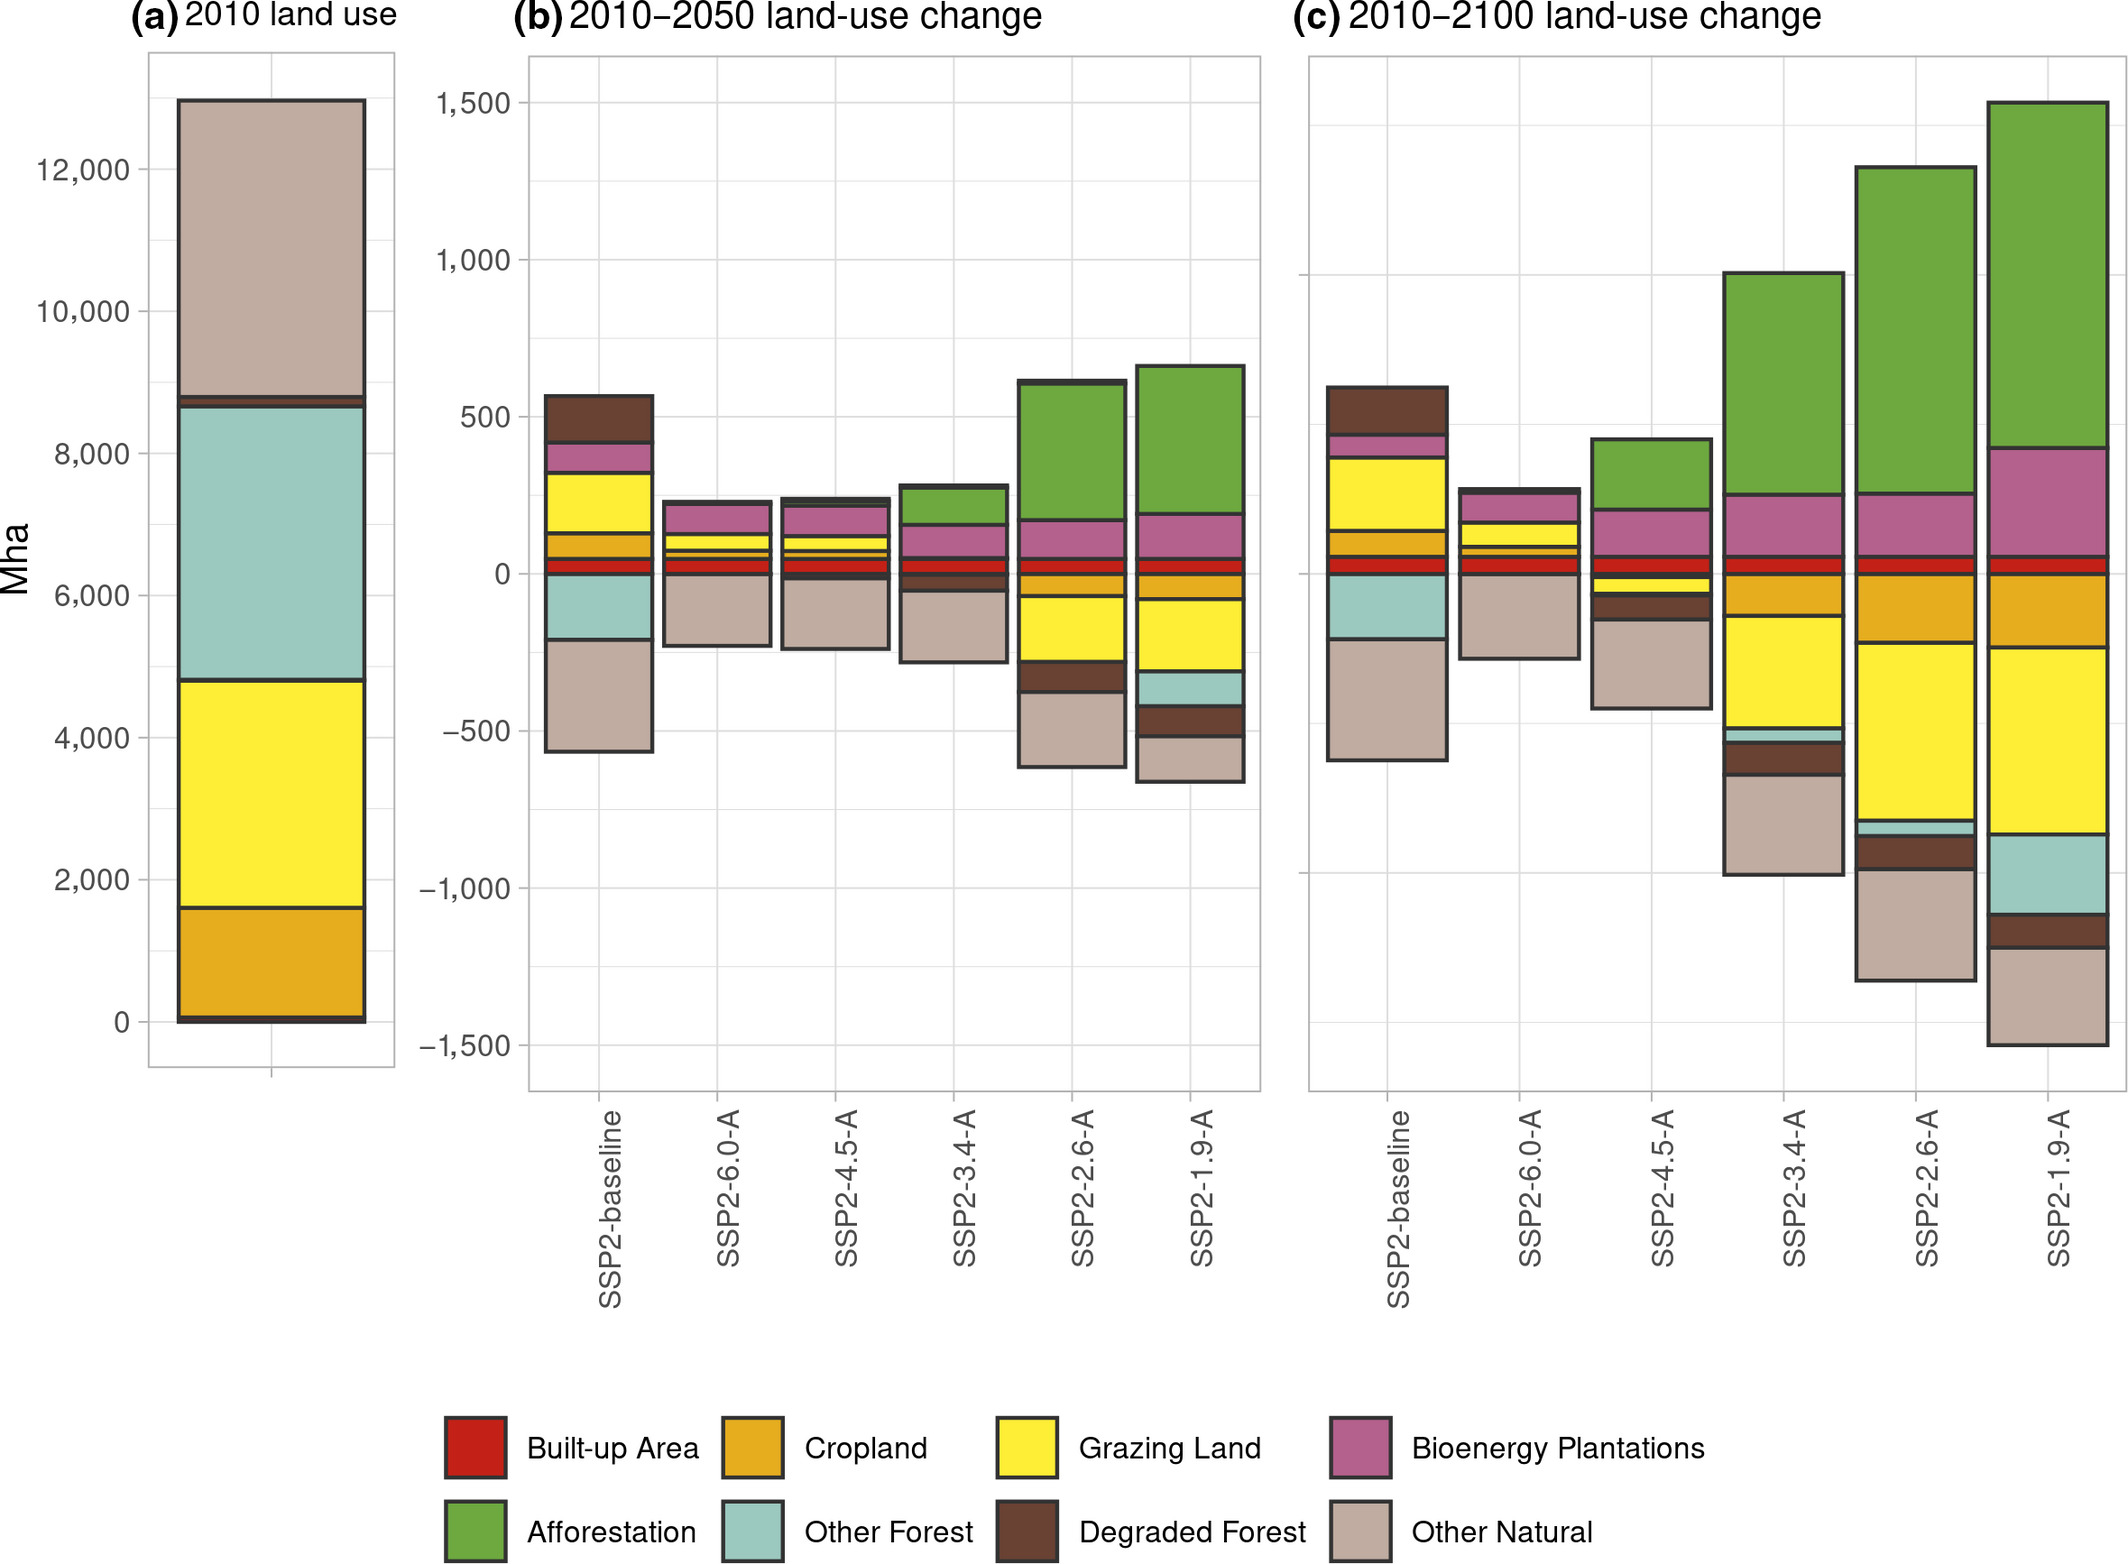
| | |Caption=(a) Land use in 2010. Land-use change in (b) 2010–2050 and (c) 2010–2100 for the scenarios with afforestation (Doelman et al., 2020) | ||
|FigureType=Policy intervention figure | |FigureType=Policy intervention figure | ||
|OptimalSize=600 | |OptimalSize=600 | ||
|Component=Agricultural economy | |Component=Agricultural economy | ||
}} | }} | ||
Latest revision as of 16:37, 31 October 2021
Caption: (a) Land use in 2010. Land-use change in (b) 2010–2050 and (c) 2010–2100 for the scenarios with afforestation (Doelman et al., 2020)
Figure is used on page(s): Agricultural economy