Agricultural economy
Parts of Agricultural economy
| Component is implemented in: |
|
| Related IMAGE components |
| Projects/Applications |
| Key publications |
| References |
Key policy issues
- What is the area of cropland and grassland required to support future food demand?
- What are the policy options to reduce agricultural land use and to safeguard global biodiversity, while ensuring food security?
- How can the implications of biofuels for land use and greenhouse gases be managed sustainably?
Introduction
As a result of the growing world population and higher per capita consumption, the production of food, feed, fibers, and other products, such as bioenergy and timber, will need to increase rapidly in the coming decades. Even with the expected improvements in agricultural yields and efficiency, there will be increasing demand for more agricultural land. However, the expansion of agricultural land will lead to deforestation and increases in greenhouse gas emissions, loss of biodiversity and ecosystem services, and nutrient imbalances. To reduce these environmental impacts, a further increase in agricultural yields is needed, together with other options such as reduced food losses, dietary changes, improved livestock systems, and better nutrient management.
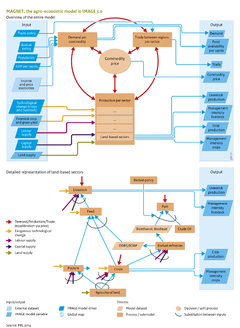
In the IMAGE framework, the future development of the agricultural economy can be calculated using the agro-economic model MAGNET (Woltjer et al., 2014). MAGNET is a computable general equilibrium (CGE) model that is connected via a soft link to the core model of IMAGE. Demographic changes and changes in income are the primary driving factors of the MAGNET model and lead to changing demand for all commodities, including agricultural commodities. In response to this change in demand, agricultural production is increasing, and the model also considers changing prices of production factors, resource availability, and technological progress. In MAGNET, agricultural production supplies domestic markets, and other countries and regions are supplied via international trade, depending on historical trade balances, competitiveness (relative price developments), transport costs, and trade policies. MAGNET uses information from IMAGE on land availability and suitability and changes in crop yields due to climate change and agricultural expansion on heterogeneous land areas. The results from MAGNET on agricultural production, grassland area, and endogenous yield efficiency (i.e. management factor) changes are used in IMAGE to calculate spatially explicit land-use change and the environmental impacts on carbon, nutrient and water cycles, biodiversity, and climate.
Although MAGNET is the standard agro-economic model used with IMAGE, other models can be linked with IMAGE. For example, the IMPACT model was used with IMAGE in the Millennium Ecosystem Assessment (Carpenter et al., 2006), and in a PBL study on protein supply, both the MAGNET and the IMPACT model were used to study the same set of scenarios. This allowed a systematic comparison between IMPACT and MAGNET (Stehfest et al., 2013). In a more recent study van Vuuren et al., 2018 the Food Demand Model (Bijl et al., 2017) was used for projections of food demand with various diets. This is a physically oriented, statistical model using based on historical relations between income, food consumption, and regional differences, which is also an integrated part of the IMAGE framework.
Other land-use changes, such as infrastructure expansion, which do not require interregional links, are described in the land-use allocation model). Demand for timber is described on the forest management page.
New implementations in Agricultural Economy
Any economy-related agricultural implementation in IMAGE has to be taken into account by MAGNET, which processes the new inputs and delivers new levels of food and agricultural area demand and any other variables that might have been economically affected by the new implementation. This is the case for changes in diets and food waste, as described in the following.
Food Waste Reduction
High- and medium-income regions can reduce food waste to achieve the lowest level among them (low-income regions are not required to reduce waste). This implementation is based on Gustavsson et al. [REF 2011; 2013], from where we define the levels of food waste for five commodity types (cereals, other_plant_based, meat, fish_seafood, melk_eggs) and three food supply chain (FSC) steps (primary, processing, consumption). Then, we find the lowest food waste level among high- and medium-income regions for each commodity type and FSC step and define them as food waste targets. Then, we calculate the change in the production efficiency that resembles the food waste reduction necessary for the regions to achieve their food waste targets. At last, we calculate the MAGNET shock required to meet the targets and run MAGNET with the new production efficiencies, which resemble the reduction in food waste. As a result, there will be lower demand for agricultural land, which turns out to be abandoned land that can be used for afforestation, as described in [MAKE A LINK TO AFFORESTATION TOOL?]. Transitioning to the target waste levels occurs from 2020 to 2050, with shocks every ten years.
Diet Changes
Another way to reduce the impact of food consumption on the environment is by adopting healthier diets. These diets could be entirely plant-based or reduced in meat consumption, both cases leading to reduced meat demand and therefore reduced agricultural area demand. In the current implementation, there is a 50% reduction in meat consumption in High-income countries + substitution to artificial meat or plant-based diets in 2050.
Input/Output Table
Input Agricultural economy component
| IMAGE model drivers and variables | Description | Source |
|---|---|---|
| Capital supply | Capital available to replace depreciated stock and expand the stock to support economic growth. | Drivers |
| Technological change (crops and livestocks) | Increase in productivity in crop production (yield/ha) and livestock production (carcass weight, offtake rate). | Drivers |
| Labour supply | Effective supply of labour input to support economic activities, taking into account the participation rate of age cohorts. | Drivers |
| Trade policy | Assumed changes in market and non-market instruments that influence trade flows, subject to WTO rules and country and region regulation. | Drivers |
| Biofuel policy | Policies to foster the use of biofuels in transport, such as financial incentives and biofuel mandates and obligations. | Drivers |
| GDP per capita | Gross Domestic Product per capita, measured as the market value of all goods and services produced in a region in a year, and is used in the IMAGE framework as a generic indicator of economic activity. | Drivers |
| Population | Number of people per region. | Drivers |
| Land supply | Available land for agriculture, per grid or region, depending on suitability for crops, and excluding unsuitable areas such as steep slopes, wetlands and protected areas. | Land cover and land use |
| Potential crop and grass yield - grid | Potential crop and grass yield, changing over time due to climate change and possibly soil degradation. In some components, i.e. 'Agricultural economy' regional aggregations of the dataset which depend on the actual land-use area, are used. | Crops and grass |
| External datasets | Description | Source |
|---|---|---|
| Income and price elasticities | Assumptions on income and price elasticities of demand, substitution elasticities, and many other elasticities, | GTAP database, GTAP database and own assumptions |
Output Agricultural economy component
| IMAGE model variables | Description | Use |
|---|---|---|
| Crop production | Regional production per crop. | |
| Management intensity crops | Management intensity crops, expressing actual yield level compared to potential yield. While potential yield is calculated for each grid cell, this parameter is expressed at the regional level. This parameter is based on data and exogenous assumptions - current practice and technological change in agriculture - and is endogenously adapted in the agro-economic model. | |
| Management intensity livestock | Management intensity of livestock, expressed at the regional level. This parameter is based on data and exogenous assumptions, i.e. current practice and technological change in livestock sectors, and is endogenously adapted within the Agricultural economy component. | |
| Food availability per capita | Food availability per capita. | |
| Livestock production | Production of livestock products (dairy, beef, sheep and goats, pigs, poultry). | |
| Demand (all commodities) | Demand per sector including various crop and livestock sectors. | Final output |
| Trade (all commodities) | Bilateral trade between regions per sector, including various crop and livestock sectors. | Final output |
| Commodity price | Commodity price per sector, including various crop and livestock sectors.. | Final output |