Atmospheric composition and climate: Difference between revisions
m (Text replace - "Ocean carbon uptake - grid" to "Ocean carbon uptake") |
Oostenrijr (talk | contribs) m (Text replacement - "==Introduction==" to "") |
||
| (45 intermediate revisions by 3 users not shown) | |||
| Line 1: | Line 1: | ||
{{ComponentTemplate2 | {{ComponentTemplate2 | ||
|IMAGEComponent= | |Application=Representative Concentration Pathways - RCP (2009); | ||
| | |IMAGEComponent=Crops and grass; Carbon cycle and natural vegetation; Emissions; Climate policy; Air pollution and energy policies; Land and biodiversity policies; Nutrients; Water; Human development; | ||
|KeyReference=Van Vuuren and Stehfest, 2013 | |Model-Database=LPJmL model; AR4 (IPCC) database; | ||
|Reference=IPCC, 2007a; | |KeyReference=Van Vuuren and Stehfest, 2013; Meinshausen et al., 2011b; Müller et al., 2016b; | ||
|InputVar= | |Reference=IPCC, 2007a; IPCC, 2013; Meinshausen et al., 2011a; | ||
|InputVar=BC, OC and NOx emissions; SO2 emissions; CO and NMVOC emissions; Non-CO2 GHG emissions (CH4, N2O and Halocarbons); CO2 emission from energy and industry; Land-use CO2 emissions - grid; NEP (net ecosystem production) - grid; Number of wet days - grid; Cloudiness - grid; | |||
|Parameter=MAGICC parameter settings; Radiative forcing factors; | |Parameter=MAGICC parameter settings; Radiative forcing factors; GCM pattern (temperature, precipitation) - grid; Sulphate pattern - grid; | ||
| | |OutputVar=CO2 concentration; Non-CO2 GHG concentrations; CO2 concentration; Radiative forcing; Global mean temperature; Temperature - grid; Precipitation - grid; Ocean carbon uptake; Number of wet days - grid; Cloudiness - grid; | ||
|ComponentCode=ACC | |ComponentCode=ACC | ||
|AggregatedComponent=Earth System | |AggregatedComponent=Earth System | ||
|FrameworkElementType=state component | |FrameworkElementType=state component | ||
}} | }} | ||
<div class="page_standard"> | |||
Climate change is considered to be one of the most important effects of human activities on the environment. Emissions from fossil fuels, industry, land use and land-use change have increased greenhouse gas concentrations and led to almost 1 °C rise in global mean temperature on pre-industrial levels ([[IPCC, 2007a]]; [[IPCC, 2013]]). The impacts are already visible and are expected to increase in the coming century. Without further action, mean global temperature could increase by 2.6 – 4.8 °C (5-95 percentile, RCP8.5) by the end of this century ([[IPCC, 2013]]). Climate change impacts manifest themselves in all world regions, and affect almost all aspects of human activity. | |||
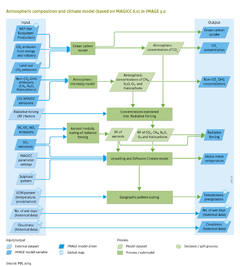
Modelling climate change (changes in temperature and precipitation) is central in global integrated assessments of baseline developments in climate change and of climate policy options. IMAGE uses the simple climate model [[MAGICC model|MAGICC 6.0]] ([[Meinshausen et al., 2011a]]; [[Meinshausen et al., 2011b]]) to simulate the effects of changing greenhouse gas emissions on atmospheric composition, radiative forcing and global mean temperature. MAGICC was used extensively in the Third, Fourth, and Fifth assessment reports of {{abbrTemplate|IPCC}} (Intergovernmental Panel on Climate Change) in assessing a range of greenhouse gas concentration scenarios. Since publication of these reports, MAGICC has been updated in line with results from Atmosphere-Ocean General Circulation Models ({{abbrTemplate|AOGCM}}s). | |||
There is still considerable uncertainty in climate change simulations, as illustrated by differences in results from various AOGCMs, in terms of mean global temperature, and even more so in geographical patterns of surface temperature and precipitation. By adjusting the values of a few of the model parameters, MAGICC6.0 can reproduce time-dependent responses of AOGCMs ([[Meinshausen et al., 2011a]]; [[Meinshausen et al., 2011b]]). This allows IMAGE to reflect the uncertainty in {{abbrTemplate|AOGCM}} results, and to provide plausible projections of future climate-change feedbacks and impacts. | |||
The analysis of climate impacts and feedbacks requires only location-specific temperature and precipitation changes. Thus, a pattern scaling technique is applied in IMAGE by combining MAGICC results with maps on climate change from the same AOGCMs assessed in {{abbrTemplate|AR}}4 ([[IPCC, 2007a]]) and used for calibrating MAGICC. The consistent combination of AOGCM-specific parameter settings for MAGICC and matching geographical patterns of climate change make the dynamic results from IMAGE physically more consistent, and extend the range of uncertainties that can be covered to include future climate change. | |||
{{InputOutputParameterTemplate}} | |||
</div> | |||
Latest revision as of 15:25, 1 April 2020
Parts of Atmospheric composition and climate
| Component is implemented in: |
|
| Related IMAGE components |
| Projects/Applications |
| Models/Databases |
| Key publications |
| References |
Key policy issues
- What would be the impact of global climate change in this century without additional mitigation policies and measures?
- To what extent would the various scenarios to significantly reduce net greenhouse gas emissions lead to a reduction in climate change?
- To what extent does the uncertainty of geographical patterns in temperature and precipitation change influence future climate impacts and response strategies?
Introduction
Climate change is considered to be one of the most important effects of human activities on the environment. Emissions from fossil fuels, industry, land use and land-use change have increased greenhouse gas concentrations and led to almost 1 °C rise in global mean temperature on pre-industrial levels (IPCC, 2007a; IPCC, 2013). The impacts are already visible and are expected to increase in the coming century. Without further action, mean global temperature could increase by 2.6 – 4.8 °C (5-95 percentile, RCP8.5) by the end of this century (IPCC, 2013). Climate change impacts manifest themselves in all world regions, and affect almost all aspects of human activity.
Modelling climate change (changes in temperature and precipitation) is central in global integrated assessments of baseline developments in climate change and of climate policy options. IMAGE uses the simple climate model MAGICC 6.0 (Meinshausen et al., 2011a; Meinshausen et al., 2011b) to simulate the effects of changing greenhouse gas emissions on atmospheric composition, radiative forcing and global mean temperature. MAGICC was used extensively in the Third, Fourth, and Fifth assessment reports of IPCC (Intergovernmental Panel on Climate Change) in assessing a range of greenhouse gas concentration scenarios. Since publication of these reports, MAGICC has been updated in line with results from Atmosphere-Ocean General Circulation Models (AOGCMs).
There is still considerable uncertainty in climate change simulations, as illustrated by differences in results from various AOGCMs, in terms of mean global temperature, and even more so in geographical patterns of surface temperature and precipitation. By adjusting the values of a few of the model parameters, MAGICC6.0 can reproduce time-dependent responses of AOGCMs (Meinshausen et al., 2011a; Meinshausen et al., 2011b). This allows IMAGE to reflect the uncertainty in AOGCM results, and to provide plausible projections of future climate-change feedbacks and impacts.
The analysis of climate impacts and feedbacks requires only location-specific temperature and precipitation changes. Thus, a pattern scaling technique is applied in IMAGE by combining MAGICC results with maps on climate change from the same AOGCMs assessed in AR4 (IPCC, 2007a) and used for calibrating MAGICC. The consistent combination of AOGCM-specific parameter settings for MAGICC and matching geographical patterns of climate change make the dynamic results from IMAGE physically more consistent, and extend the range of uncertainties that can be covered to include future climate change.
Input/Output Table
Input Atmospheric composition and climate component
| IMAGE model drivers and variables | Description | Source |
|---|---|---|
| Number of wet days - grid (historical data) | Number of days with a rain event, per month; assumed constant after the historical period | CRU database |
| Cloudiness - grid (historical data) | Percentage of cloudiness per month; assumed constant after the historical period | CRU database |
| CO2 emission from energy and industry | CO2 emission from energy and industry. | Emissions |
| Land-use CO2 emissions - grid | Land-use CO2 emissions from deforestation, wood harvest, agricultural harvest, bioenergy plantations and timber decay. | Carbon cycle and natural vegetation |
| BC, OC and NOx emissions | Emissions of BC, OC and NOx per year. | Emissions |
| NEP (net ecosystem production) - grid | Net natural exchange of CO2 between biosphere and atmosphere (NPP minus soil respiration), excluding human induced fluxes such as decay of wood products. | Carbon cycle and natural vegetation |
| SO2 emissions | SO2 emissions, per source (e.g. fossil fuel burning, deforestation). | Emissions |
| CO and NMVOC emissions | Emissions from CO and NMVOC. | Emissions |
| Non-CO2 GHG emissions (CH4, N2O and Halocarbons) | Non-CO2 GHG emissions (CH4, N2O, Halocarbons). | Emissions |
| External datasets | Description | Source |
|---|---|---|
| GCM pattern (temperature, precipitation) - grid | Climate change patterns of General Circulation models used to downscale changes in global mean temperature to changes in temperature and precipitation at grid level; default pattern from HadCM3 of the Hadley Centre. | AR4 (IPCC) database |
| MAGICC parameter settings | MAGICC 6.0 parameters calibrated to emulate one out of 19 climate models. | Meinshausen et al., 2011a |
| Radiative forcing factors | Radiative forcing per greenhouse gas. | Forster et al., 2007 |
| Sulphate pattern - grid | Patterns of climate change to compute non-linear regional radiative effects of sulphate aerosols. |
Output Atmospheric composition and climate component
| IMAGE model variables | Description | Use |
|---|---|---|
| Global mean temperature | Average global temperature. | |
| Temperature - grid | Monthly average temperature. | |
| Precipitation - grid | Monthly total precipitation. | |
| CO2 concentration | Atmospheric CO2 concentration. | |
| Ocean carbon uptake | Ocean carbon uptake. | |
| Radiative forcing | Radiative forcing of greenhouse gases, ozone, and aerosols. | Final output |
| Non-CO2 GHG concentrations | Atmospheric concentration of non-CO2 greenhouse gases. | Final output |
| Number of wet days - grid | Number of days with a rain event, per month; assumed constant after the historical period | |
| Cloudiness - grid | Percentage of cloudiness per month; assumed constant after the historical period |