Climate policy/Policy issues: Difference between revisions
No edit summary |
Oostenrijr (talk | contribs) m (Text replacement - "Harmsen et al. (2016)" to "Harmsen et al., 2016") |
||
| (39 intermediate revisions by 6 users not shown) | |||
| Line 1: | Line 1: | ||
{{ComponentPolicyIssueTemplate | {{ComponentPolicyIssueTemplate | ||
|Reference=Den Elzen et al., 2007; Den Elzen and van Vuuren, 2007; Van Vuuren et al., 2011a; Van Vuuren et al., 2012; European Commission, 2010; Den Elzen et al., 2012b; Den Elzen et al., 2011b; UNEP, 2012; Hof et al., 2013; Höhne et al., 2012; Roelfsema et al., 2013; Roelfsema et al., 2014; Den Elzen and Höhne, 2010; Den Elzen et al., 2012a; Hof et al., 2012; Mendoza Beltrán et al., 2011; Hof et al., 2011; Hof et al., 2008; Hof et al., 2010; Den Elzen et al., 2012c; Van Vliet et al., 2012; Admiraal et al., 2016; Van den Berg et al., 2015; Harmsen et al., 2016; UNEP (2016); Rogelj et al., 2016; Den Elzen et al., 2015a; Kuramochi et al., 2016; Hof et al., 2016; | |||
|Reference=Den Elzen et al., 2007; Den Elzen and van Vuuren, 2007 | }} | ||
<div class="page_standard"> | |||
==Policy analyses== | |||
[[FAIR model|FAIR]] can be used to analyse baseline developments, such as expected climate change damage. However, more often baseline developments are explored using the larger IMAGE framework, and the FAIR model receives this information as input for policy analysis. | |||
As part of the IMAGE framework, FAIR can be used to evaluate a range of policies and strategies, including: | |||
* Long-term mitigation strategies such as emission reductions over time ([[Van Vliet et al., 2012]]); | |||
* Evaluation of current reduction proposals by countries and policy options until 2030 ([[Den Elzen et al., 2016]]; [[Den Elzen et al., 2019]]); | |||
* Evaluation of domestic climate and energy policies up to 2030 ([[Kuramochi et al., 2016]]; [[Kuramochi et al., 2018]]; [[Roelfsema et al., 2018]]); | |||
* Evaluation of burden sharing or effort sharing regimes ([[Den Elzen et al., 2012a]]; [[Hof et al., 2012]]; [[Hof et al., 2016]]; [[Van den Berg, 2019]]); | |||
* Analysis of regional abatement costs and emission trading ([[Den Elzen et al., 2008]]; [[Den Elzen et al., 2011a]]; [[Mendoza Beltrán et al., 2011]]; [[Hof et al., 2017]]); | |||
* Evaluation of proposals for financing climate policies ([[Hof et al., 2009]]; [[Hof et al., 2011|2011]]); | |||
* Evaluation of trade-offs between mitigation costs, adaptation costs and the benefits of reduced climate damage ([[Hof et al., 2008]]; [[Hof et al., 2009|2009]]; [[Hof et al., 2010|2010]]; [[Admiraal et al., 2016]]); | |||
* Assessment of the policy costs, emission profiles and climate effects resulting from the use of different climate metrics such as the {{abbrTemplate|GWP}} ([[Van den Berg et al., 2015]]; [[Harmsen et al., 2016]]); | |||
==Policy interventions== | |||
[!CHANGE]The Global Pathfinder module FAIR-SiMCaP was used to determine what the pledges for 2020 and the {{abbrTemplate|INDC}} targets (mainly for 2030) imply for global emission pathways consistent with meeting the 2 °C target ([[Hof et al., 2016]]; [[Van Vliet et al., 2012]]). The mitigation costs module has been applied to compare the mitigation costs for 2030 resulting from implementation of the NDCs with reductions required for achieving the climate targets of the Paris Agreement ([[Hof et al., 2017]]). The main findings of these studies were as follows (see also the figure below): | |||
The | * The global 2030 emission level resulting from implementation of the NDCs exceeds those of least-cost pathways that achieve a 2 °C target; | ||
* Slightly postponing mitigation action compared to the least-cost scenario seems technically feasible but at higher cumulative discounted mitigation costs; | |||
*A delay in emission reductions limits the flexibility in the portfolio of emission reduction options. Such delayed scenarios rely more on the use of bioenergy with carbon capture and storage ({{abbrTemplate|BECCS}}), an option with uncertain prospects for large-scale implementation. | |||
*Abatement costs are very sensitive to socioeconomic developments: with slow economic growth rapid population growth, and high inequality, mitigation costs of achieving all unconditional NDCs are estimated at USD 135 billion in 2030 - which is more than twice the level as under more sustainable socioeconomic developments. | |||
*Allowing emission trading could decrease the global costs of achieving the NDC targets considerably by about 50%. | |||
*The required effort in terms of mitigation costs of achieving 2030 emission levels consistent with 2°C pathways is about three times higher than the costs of achieving the conditional NDCs. | |||
{{DisplayFigureLeftOptimalTemplate|002g ind16_CP}}[!CHANGE] | |||
{{PIEffectOnComponentTemplate }} | |||
</div> | |||
}} | |||
Latest revision as of 07:24, 3 April 2019
Parts of Climate policy/Policy issues
Policy analyses
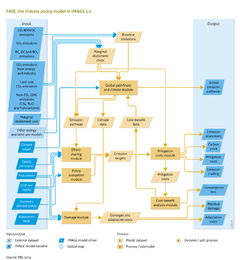
FAIR can be used to analyse baseline developments, such as expected climate change damage. However, more often baseline developments are explored using the larger IMAGE framework, and the FAIR model receives this information as input for policy analysis.
As part of the IMAGE framework, FAIR can be used to evaluate a range of policies and strategies, including:
- Long-term mitigation strategies such as emission reductions over time (Van Vliet et al., 2012);
- Evaluation of current reduction proposals by countries and policy options until 2030 (Den Elzen et al., 2016; Den Elzen et al., 2019);
- Evaluation of domestic climate and energy policies up to 2030 (Kuramochi et al., 2016; Kuramochi et al., 2018; Roelfsema et al., 2018);
- Evaluation of burden sharing or effort sharing regimes (Den Elzen et al., 2012a; Hof et al., 2012; Hof et al., 2016; Van den Berg, 2019);
- Analysis of regional abatement costs and emission trading (Den Elzen et al., 2008; Den Elzen et al., 2011a; Mendoza Beltrán et al., 2011; Hof et al., 2017);
- Evaluation of proposals for financing climate policies (Hof et al., 2009; 2011);
- Evaluation of trade-offs between mitigation costs, adaptation costs and the benefits of reduced climate damage (Hof et al., 2008; 2009; 2010; Admiraal et al., 2016);
- Assessment of the policy costs, emission profiles and climate effects resulting from the use of different climate metrics such as the GWP (Van den Berg et al., 2015; Harmsen et al., 2016);
Policy interventions
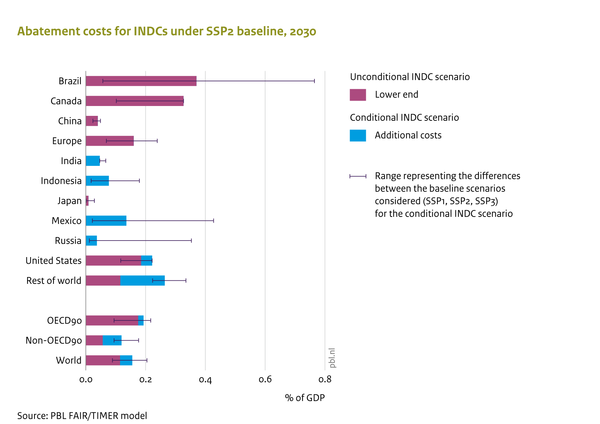
[!CHANGE]The Global Pathfinder module FAIR-SiMCaP was used to determine what the pledges for 2020 and the INDC targets (mainly for 2030) imply for global emission pathways consistent with meeting the 2 °C target (Hof et al., 2016; Van Vliet et al., 2012). The mitigation costs module has been applied to compare the mitigation costs for 2030 resulting from implementation of the NDCs with reductions required for achieving the climate targets of the Paris Agreement (Hof et al., 2017). The main findings of these studies were as follows (see also the figure below):
- The global 2030 emission level resulting from implementation of the NDCs exceeds those of least-cost pathways that achieve a 2 °C target;
- Slightly postponing mitigation action compared to the least-cost scenario seems technically feasible but at higher cumulative discounted mitigation costs;
- A delay in emission reductions limits the flexibility in the portfolio of emission reduction options. Such delayed scenarios rely more on the use of bioenergy with carbon capture and storage (BECCS), an option with uncertain prospects for large-scale implementation.
- Abatement costs are very sensitive to socioeconomic developments: with slow economic growth rapid population growth, and high inequality, mitigation costs of achieving all unconditional NDCs are estimated at USD 135 billion in 2030 - which is more than twice the level as under more sustainable socioeconomic developments.
- Allowing emission trading could decrease the global costs of achieving the NDC targets considerably by about 50%.
- The required effort in terms of mitigation costs of achieving 2030 emission levels consistent with 2°C pathways is about three times higher than the costs of achieving the conditional NDCs.
Effects of policy interventions on this component
| Policy intervention | Description | Effect |
|---|---|---|
| Carbon tax (*) | A tax on carbon leads to higher prices for carbon intensive fuels (such as fossil fuels), making low-carbon alternatives more attractive. | In the climate policy component, the carbon tax leads to emission reductions via Marginal Abatement Cost (MAC) curves derived from the TIMER model. |
| Climate change adaptation (*) | Adaptation to climate change reduces climate damage. The model can optimally calculate the optimal adaptation level based on marginal adaptation costs and marginal avoided damage, but an alternative adaptation level can be used as well. (Reference:: Hof et al., 2009, Hof et al., 2010) | More adaptation increases adaptation costs, but reduces the damage resulting from climate change. (Reference:: De Bruin et al., 2009) |
| Effort- or burden-sharing of emission reductions (*) | Evaluation of burden-sharing or effort-sharing regimes. Which regions or countries should contribute, when and by how much to reduce global greenhouse gas emissions? (Reference:: Hof et al., 2012, Den Elzen et al., 2012b, Den Elzen and Höhne, 2010) | The burden-sharing regime affects regional mitigation costs, as different burden-sharing rules lead to different emission reduction targets. |
| Emission trading policy (*) | Analysis of the effect of rules for trading emission credits on regional abatement costs. (Reference:: Den Elzen et al., 2011a, Den Elzen et al., 2008, Mendoza Beltrán et al., 2011) | Different rules for trading emission credits lead to different regional mitigation costs. Without any restrictions on emission trading, emission reductions take place wherever it is cheapest to do so and the differences between regional targets and actual domestic emissions is traded among regions. |
| Financing climate policy (*) | Developed countries could provide financial resources to assist developing countries by implementation of mitigation and adaptation policies. To mobilise these funds, several mechanisms exist, of which the effect can be analysed (Reference:: Hof et al., 2009, Hof et al., 2011) | Implementation of climate financing proposals affect regional mitigation costs, as regions have to contribute to financing. The funds mobilised can be used to finance climate policies of the least developed regions. |
| Reduction proposals (pledges) (*) | Evaluation of current reduction proposals by countries and policy options (for the next 10-20 years). (Reference:: UNEP (2016), Den Elzen et al., 2012a, Den Elzen et al., 2011a, Den Elzen et al., 2011b, Hof et al., 2013) | The pledges affect near-term regional emission reductions, thereby influencing mitigation costs. |