Climate policy/Policy issues: Difference between revisions
Jump to navigation
Jump to search
(*) Implemented in this component.
Oostenrijr (talk | contribs) No edit summary |
m (updated references) |
||
| Line 3: | Line 3: | ||
}} | }} | ||
<div class="page_standard"> | <div class="page_standard"> | ||
== | ==Policy analyses== | ||
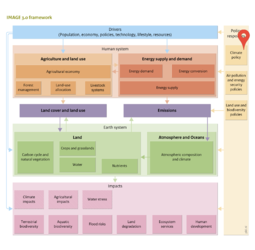
[[FAIR model|FAIR]] can be used to analyse baseline developments, such as expected climate change damage. However, more often baseline developments are explored using the larger IMAGE framework, and the FAIR model receives this information as input for policy analysis. | [[FAIR model|FAIR]] can be used to analyse baseline developments, such as expected climate change damage. However, more often baseline developments are explored using the larger IMAGE framework, and the FAIR model receives this information as input for policy analysis. | ||
As part of the IMAGE framework, FAIR can be used to evaluate a range of policies and strategies, including: | As part of the IMAGE framework, FAIR can be used to evaluate a range of policies and strategies, including: | ||
* Long-term mitigation strategies such as emission reductions over time ( | * Long-term mitigation strategies such as emission reductions over time ([[Van Vliet et al., 2012]]); | ||
* Evaluation of current reduction proposals by countries and policy options until 2030 ([[Den Elzen et al., | * Evaluation of current reduction proposals by countries and policy options until 2030 ([[Den Elzen et al., 2016]]; [[Den Elzen et al., 2019]]); | ||
* Evaluation of domestic climate and energy policies | * Evaluation of domestic climate and energy policies up to 2030 ([[Kuramochi et al., 2016]]; [[Kuramochi et al., 2018]]; [[Roelfsema et al., 2018]]); | ||
* Evaluation of burden sharing or effort sharing regimes ( | * Evaluation of burden sharing or effort sharing regimes ([[Den Elzen et al., 2012a]]; [[Hof et al., 2012]]; [[Hof et al., 2016]]; [[Van den Berg, 2019]]); | ||
* Analysis of regional abatement costs and emission trading ([[Den Elzen et al., 2008]]; [[Den Elzen et al., 2011a]]; [[Mendoza Beltrán et al., 2011]]); | * Analysis of regional abatement costs and emission trading ([[Den Elzen et al., 2008]]; [[Den Elzen et al., 2011a]]; [[Mendoza Beltrán et al., 2011]]; [[Hof et al., 2017]]); | ||
* Evaluation of proposals for financing climate policies ([[Hof et al., 2009]]; [[Hof et al., 2011|2011]]); | * Evaluation of proposals for financing climate policies ([[Hof et al., 2009]]; [[Hof et al., 2011|2011]]); | ||
* Evaluation of trade-offs between mitigation costs, adaptation costs and the benefits of reduced climate damage ([[Hof et al., 2008]]; [[Hof et al., 2009|2009]]; [[Hof et al., 2010|2010]] | * Evaluation of trade-offs between mitigation costs, adaptation costs and the benefits of reduced climate damage ([[Hof et al., 2008]]; [[Hof et al., 2009|2009]]; [[Hof et al., 2010|2010]]; [[Admiraal et al., 2016]]); | ||
* Assessment of the policy costs, emission profiles and climate effects resulting from the use of different climate metrics such as the {{abbrTemplate|GWP}} ([[Van den Berg et al., 2015]]; [[Harmsen et al. (2016)]]); | * Assessment of the policy costs, emission profiles and climate effects resulting from the use of different climate metrics such as the {{abbrTemplate|GWP}} ([[Van den Berg et al., 2015]]; [[Harmsen et al. (2016)]]); | ||
==Policy interventions== | ==Policy interventions== | ||
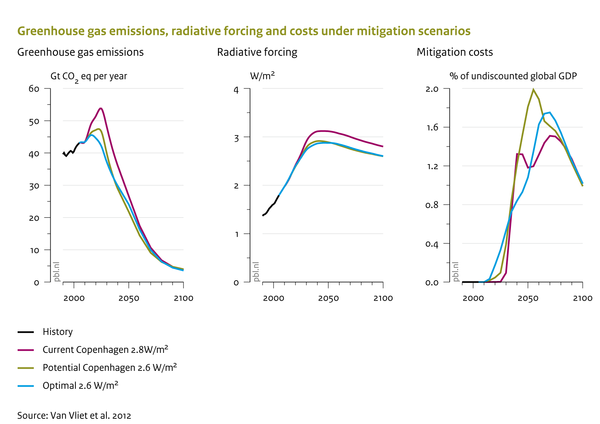
The Global Pathfinder module FAIR-SiMCaP was used to determine what the pledges for 2020 and the {{abbrTemplate|INDC}} targets (mainly for 2030) imply for global emission pathways consistent with meeting the 2 °C target ([[Van Vliet et al., 2012]], [[UNEP (2016)]], [[Den Elzen et al., 2016]] | The Global Pathfinder module FAIR-SiMCaP was used to determine what the pledges for 2020 and the {{abbrTemplate|INDC}} targets (mainly for 2030) imply for global emission pathways consistent with meeting the 2 °C target ([[Van Vliet et al., 2012]], [[UNEP (2016)]], [[Den Elzen et al., 2016]]). The main findings were as follows (see also the figure below): | ||
* The global 2020 emission level resulting from implementation of the Copenhagen Accord pledges exceeds those of least-cost pathways that achieve a 2 °C target; | * The global 2020 emission level resulting from implementation of the Copenhagen Accord pledges exceeds those of least-cost pathways that achieve a 2 °C target; | ||
* Slightly postponing mitigation action compared to the least-cost scenario seems technically feasible but at higher cumulative discounted mitigation costs; | * Slightly postponing mitigation action compared to the least-cost scenario seems technically feasible but at higher cumulative discounted mitigation costs; | ||
Revision as of 15:36, 5 March 2019
Parts of Climate policy/Policy issues
Policy analyses
FAIR can be used to analyse baseline developments, such as expected climate change damage. However, more often baseline developments are explored using the larger IMAGE framework, and the FAIR model receives this information as input for policy analysis.
As part of the IMAGE framework, FAIR can be used to evaluate a range of policies and strategies, including:
- Long-term mitigation strategies such as emission reductions over time (Van Vliet et al., 2012);
- Evaluation of current reduction proposals by countries and policy options until 2030 (Den Elzen et al., 2016; Den Elzen et al., 2019);
- Evaluation of domestic climate and energy policies up to 2030 (Kuramochi et al., 2016; Kuramochi et al., 2018; Roelfsema et al., 2018);
- Evaluation of burden sharing or effort sharing regimes (Den Elzen et al., 2012a; Hof et al., 2012; Hof et al., 2016; Van den Berg, 2019);
- Analysis of regional abatement costs and emission trading (Den Elzen et al., 2008; Den Elzen et al., 2011a; Mendoza Beltrán et al., 2011; Hof et al., 2017);
- Evaluation of proposals for financing climate policies (Hof et al., 2009; 2011);
- Evaluation of trade-offs between mitigation costs, adaptation costs and the benefits of reduced climate damage (Hof et al., 2008; 2009; 2010; Admiraal et al., 2016);
- Assessment of the policy costs, emission profiles and climate effects resulting from the use of different climate metrics such as the GWP (Van den Berg et al., 2015; Harmsen et al. (2016));
Policy interventions
The Global Pathfinder module FAIR-SiMCaP was used to determine what the pledges for 2020 and the INDC targets (mainly for 2030) imply for global emission pathways consistent with meeting the 2 °C target (Van Vliet et al., 2012, UNEP (2016), Den Elzen et al., 2016). The main findings were as follows (see also the figure below):
- The global 2020 emission level resulting from implementation of the Copenhagen Accord pledges exceeds those of least-cost pathways that achieve a 2 °C target;
- Slightly postponing mitigation action compared to the least-cost scenario seems technically feasible but at higher cumulative discounted mitigation costs;
- Despite the reductions from the INDCs, the global and G20 emission level is still projected to be higher in 2030 than it was in 2010.
- The 2030 emissions are expected to reach 54 to 56 gigatonnes of carbon dioxide equivalent – far above the level of 42 needed to have a chance of limiting global warming to 2 degrees Celsius this century.
- For an even longer delay (the current Copenhagen scenario), the FAIR-SiMCaP model cannot fully compensate the higher emission level in the short term;
- A delay in emission reductions limits the flexibility in the portfolio of emission reduction options. Such delayed scenarios rely more on the use of bioenergy with carbon capture and storage (BECCS), an option with uncertain prospects for large-scale implementation.
Effects of policy interventions on this component
| Policy intervention | Description | Effect |
|---|---|---|
| Carbon tax (*) | A tax on carbon leads to higher prices for carbon intensive fuels (such as fossil fuels), making low-carbon alternatives more attractive. | In the climate policy component, the carbon tax leads to emission reductions via Marginal Abatement Cost (MAC) curves derived from the TIMER model. |
| Climate change adaptation (*) | Adaptation to climate change reduces climate damage. The model can optimally calculate the optimal adaptation level based on marginal adaptation costs and marginal avoided damage, but an alternative adaptation level can be used as well. (Reference:: Hof et al., 2009, Hof et al., 2010) | More adaptation increases adaptation costs, but reduces the damage resulting from climate change. (Reference:: De Bruin et al., 2009) |
| Effort- or burden-sharing of emission reductions (*) | Evaluation of burden-sharing or effort-sharing regimes. Which regions or countries should contribute, when and by how much to reduce global greenhouse gas emissions? (Reference:: Hof et al., 2012, Den Elzen et al., 2012b, Den Elzen and Höhne, 2010) | The burden-sharing regime affects regional mitigation costs, as different burden-sharing rules lead to different emission reduction targets. |
| Emission trading policy (*) | Analysis of the effect of rules for trading emission credits on regional abatement costs. (Reference:: Den Elzen et al., 2011a, Den Elzen et al., 2008, Mendoza Beltrán et al., 2011) | Different rules for trading emission credits lead to different regional mitigation costs. Without any restrictions on emission trading, emission reductions take place wherever it is cheapest to do so and the differences between regional targets and actual domestic emissions is traded among regions. |
| Financing climate policy (*) | Developed countries could provide financial resources to assist developing countries by implementation of mitigation and adaptation policies. To mobilise these funds, several mechanisms exist, of which the effect can be analysed (Reference:: Hof et al., 2009, Hof et al., 2011) | Implementation of climate financing proposals affect regional mitigation costs, as regions have to contribute to financing. The funds mobilised can be used to finance climate policies of the least developed regions. |
| Reduction proposals (pledges) (*) | Evaluation of current reduction proposals by countries and policy options (for the next 10-20 years). (Reference:: UNEP (2016), Den Elzen et al., 2012a, Den Elzen et al., 2011a, Den Elzen et al., 2011b, Hof et al., 2013) | The pledges affect near-term regional emission reductions, thereby influencing mitigation costs. |