Flood risks/Description: Difference between revisions
Jump to navigation
Jump to search
No edit summary |
Oostenrijr (talk | contribs) No edit summary |
||
| Line 2: | Line 2: | ||
|Reference=Loveland et al., 2000; Van Beek et al., 2011; Wada et al., 2011; Hinkel and Klein, 2009; | |Reference=Loveland et al., 2000; Van Beek et al., 2011; Wada et al., 2011; Hinkel and Klein, 2009; | ||
|Description====Model core=== | |Description====Model core=== | ||
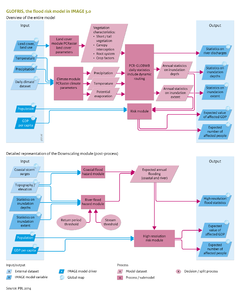
[[GLOFRIS model|GLOFRIS]] estimates the effect of land cover and climate change on global flood risks in river catchments and coastal areas ([[Winsemius et al., 2012]]; [[Ward et al., 2013]]). Global flood risks are expressed as the projected number of people affected annually and as GDP value. GLOFRIS uses land-cover input from IMAGE and climate time series, such as the IPCC GCM projections. These input data drive the global hydrological model, [[PCR-GLOBWB model|PCR-GLOBWB]], the computational core of the module. PCR-GLOBWB calculates where and when flooding events may occur, and calculates the inundation extent and inundation depth needed to estimate flood risks. PCR-GLOBWB has features, namely daily time steps and proper accounting of the relationship between non-linear soil moisture and run-off, that make it appropriate for simulating flooding events. The spatial resolution currently used by the model is 0.5x0.5 degrees. The model steps of GLOFRIS are shown in | [[GLOFRIS model|GLOFRIS]] estimates the effect of land cover and climate change on global flood risks in river catchments and coastal areas ([[Winsemius et al., 2012]]; [[Ward et al., 2013]]). Global flood risks are expressed as the projected number of people affected annually and as GDP value. GLOFRIS uses land-cover input from IMAGE and climate time series, such as the IPCC GCM projections. These input data drive the global hydrological model, [[PCR-GLOBWB model|PCR-GLOBWB]], the computational core of the module. PCR-GLOBWB calculates where and when flooding events may occur, and calculates the inundation extent and inundation depth needed to estimate flood risks. PCR-GLOBWB has features, namely daily time steps and proper accounting of the relationship between non-linear soil moisture and run-off, that make it appropriate for simulating flooding events. The spatial resolution currently used by the model is 0.5x0.5 degrees. The model steps of GLOFRIS are shown in the flowchart. | ||
===Land cover=== | ===Land cover=== | ||
| Line 14: | Line 14: | ||
GLOFRIS estimates flood risk on two scales 0.5x0.5 degrees for global analyses, and 1x1 km2 for specific case studies. On a global scale, the extreme value probability distribution is directly combined with data on population and GDP, using a linear flood level–damage relationship. Thus for each year of simulation, the most extreme water level and inundated proportion from PCR-GLOBWB is used to calculate the maximum damage (in GDP or population) per grid cell. | GLOFRIS estimates flood risk on two scales 0.5x0.5 degrees for global analyses, and 1x1 km2 for specific case studies. On a global scale, the extreme value probability distribution is directly combined with data on population and GDP, using a linear flood level–damage relationship. Thus for each year of simulation, the most extreme water level and inundated proportion from PCR-GLOBWB is used to calculate the maximum damage (in GDP or population) per grid cell. | ||
An algorithm is implemented to scale down the 0.5x0.5 degrees maps of the extent and depth of annual maximum inundation to 1x1 km2, using a high-resolution digital elevation model. A scale down is needed because the spatial variability of flood hazards and flood exposure may be large and not well represented on the coarser scales in IMAGE and PCR-GLOBWB. A more accurate estimation of flood risk is obtained by converting the results to a higher resolution. The downscaling procedure may also include the risk of coastal flooding (see | An algorithm is implemented to scale down the 0.5x0.5 degrees maps of the extent and depth of annual maximum inundation to 1x1 km2, using a high-resolution digital elevation model. A scale down is needed because the spatial variability of flood hazards and flood exposure may be large and not well represented on the coarser scales in IMAGE and PCR-GLOBWB. A more accurate estimation of flood risk is obtained by converting the results to a higher resolution. The downscaling procedure may also include the risk of coastal flooding (see the flowchart, bottom). | ||
===Downscaling=== | ===Downscaling=== | ||
For scaling down in river catchments, annual extreme values of inundation depths and proportions are transformed to bank-full volumes and excess volumes per 0.5 degree cell. The bank-full volume represents the volumetric capacity of a river channel in a grid cell and is estimated according to flood volume in a user-defined return period in which flood volumes do not exceed the bank-full volume (return period threshold in | For scaling down in river catchments, annual extreme values of inundation depths and proportions are transformed to bank-full volumes and excess volumes per 0.5 degree cell. The bank-full volume represents the volumetric capacity of a river channel in a grid cell and is estimated according to flood volume in a user-defined return period in which flood volumes do not exceed the bank-full volume (return period threshold in the flowchart, bottom) under current climate and land-cover conditions. The excess bank-full volume for each year is scaled down by estimating a water level from identified river pixels. This is determined by the user-defined stream threshold (see the flowchart, bottom) that generates a flood volume in the surrounding connected pixels, resulting in the same flood volume estimated from the 0.5x0.5 degree results. The method is mass conservative with respect to the PCR-GLOBWB results on 0.5x0.5 degree cells. | ||
===Coastal flood=== | ===Coastal flood=== | ||
Revision as of 09:13, 24 June 2014
Parts of Flood risks/Description
| Component is implemented in: |
|
| Related IMAGE components |
| Models/Databases |
| Key publications |
| References |