Flood risks/Description: Difference between revisions
Jump to navigation
Jump to search
Oostenrijr (talk | contribs) No edit summary |
Oostenrijr (talk | contribs) m (Text replace - "km2" to "km<sup>2</sup>") |
||
| Line 12: | Line 12: | ||
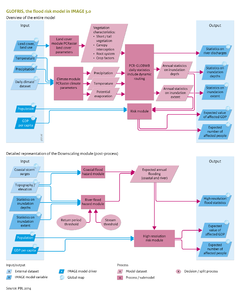
PCR-GLOBWB includes a routing component on river flooding that estimates inundation proportions and average inundation depths on a time-step basis to estimate flood risk. GLOFRIS scenarios typically cover a 30-year or longer climatological model run. From this time series, annual extreme values of the inundated proportions and water depths are derived and summarised in an extreme value probability distribution. This probability distribution is subsequently used for annual projections on the damage of flood risk. | PCR-GLOBWB includes a routing component on river flooding that estimates inundation proportions and average inundation depths on a time-step basis to estimate flood risk. GLOFRIS scenarios typically cover a 30-year or longer climatological model run. From this time series, annual extreme values of the inundated proportions and water depths are derived and summarised in an extreme value probability distribution. This probability distribution is subsequently used for annual projections on the damage of flood risk. | ||
GLOFRIS estimates flood risk on two scales 0.5x0.5 degrees for global analyses, and 1x1 | GLOFRIS estimates flood risk on two scales 0.5x0.5 degrees for global analyses, and 1x1 km<sup>2</sup> for specific case studies. On a global scale, the extreme value probability distribution is directly combined with data on population and GDP, using a linear flood level–damage relationship. Thus for each year of simulation, the most extreme water level and inundated proportion from PCR-GLOBWB is used to calculate the maximum damage (in GDP or population) per grid cell. | ||
An algorithm is implemented to scale down the 0.5x0.5 degrees maps of the extent and depth of annual maximum inundation to 1x1 | An algorithm is implemented to scale down the 0.5x0.5 degrees maps of the extent and depth of annual maximum inundation to 1x1 km<sup>2</sup>, using a high-resolution digital elevation model. A scale down is needed because the spatial variability of flood hazards and flood exposure may be large and not well represented on the coarser scales in IMAGE and PCR-GLOBWB. A more accurate estimation of flood risk is obtained by converting the results to a higher resolution. The downscaling procedure may also include the risk of coastal flooding (see the flowchart, bottom). | ||
===Downscaling=== | ===Downscaling=== | ||
Revision as of 10:40, 1 July 2014
Parts of Flood risks/Description
| Component is implemented in: |
|
| Related IMAGE components |
| Models/Databases |
| Key publications |
| References |