Flowchart Air pollution and energy policies: Difference between revisions
Jump to navigation
Jump to search
Oostenrijr (talk | contribs) No edit summary |
Oostenrijr (talk | contribs) No edit summary |
||
| (One intermediate revision by the same user not shown) | |||
| Line 5: | Line 5: | ||
|FigureType=Flowchart | |FigureType=Flowchart | ||
|OptimalSize=600 | |OptimalSize=600 | ||
|Component=Air pollution and energy policies | |||
}} | }} | ||
Latest revision as of 10:24, 20 March 2020
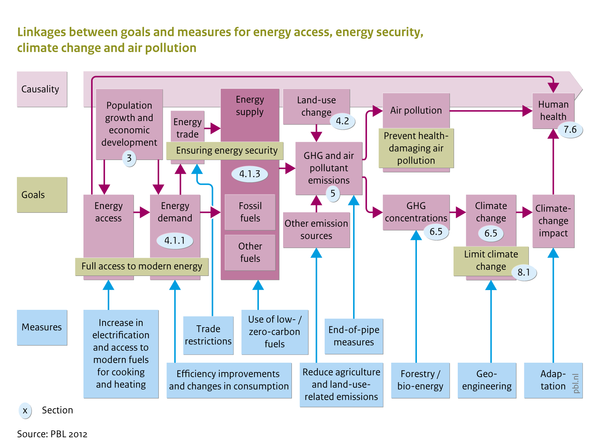
Caption: Flowchart Air pollution and energy policies. Linkages between components of the IMAGE system, energy policy objectives and possible policy measures.
Figure is used on page(s): Air pollution and energy policies, Air pollution and energy policies/Policy issues