Forest management/Policy issues: Difference between revisions
Jump to navigation
Jump to search
Oostenrijr (talk | contribs) m (Text replace - "km2" to "km<sup>2</sup>") |
No edit summary |
||
| Line 1: | Line 1: | ||
{{ComponentPolicyIssueTemplate | {{ComponentPolicyIssueTemplate | ||
|Reference=PBL, 2010; Brown, 2000; | |Reference=PBL, 2010; Brown, 2000; | ||
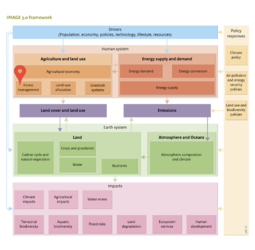
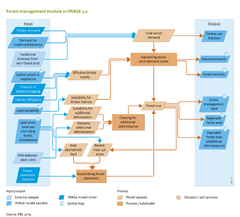
|Description=In most baseline scenarios, areas of | |Description=In most baseline scenarios, areas of managed forests increase. The IMAGE forest management model was used in the scenario study ‘Rethinking global biodiversity strategies’ on future biodiversity developments ([[PBL, 2010]]). The study projects that, in the absence of additional forestry policy, the area of forest plantations will increase only slightly between 2000 and 2050 (from 1.1 to 1.2 million km<sup>2</sup>). The total forest area for wood production will increase from 9.5 to 14.5 million km<sup>2</sup> (the figure below, left panel). According to this projection, by 2050, just over a third of the global forest area will be used for wood production and consequently. In the same year, the area of primary forest, defined in IMAGE as established before 1970 and not exploited since, will decrease by more than 6 million km<sup>2</sup> from almost 30 million km<sup>2</sup> in 2000. | ||
|Example=Several policy interventions on forest management can be simulated in the IMAGE model 3.0: | |Example=Several policy interventions on forest management can be simulated in the IMAGE model 3.0: | ||
* increase in production on highly productive forest plantations; | * increase in production on highly productive forest plantations; | ||
Revision as of 14:23, 3 November 2016
Parts of Forest management/Policy issues
| Component is implemented in: |
| Components: |
| Related IMAGE components |
| Projects/Applications |
| Key publications |
| References |