Climate policy: Difference between revisions
Jump to navigation
Jump to search
No edit summary |
No edit summary |
||
| Line 7: | Line 7: | ||
|Parameter=Other energy and land-use models; | |Parameter=Other energy and land-use models; | ||
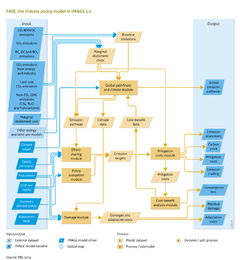
|OutputVar=Carbon price; Emission abatement; Global emission pathways; Mitigation costs; Emission trading; Consumption loss; Adaptation costs; Residual damage; | |OutputVar=Carbon price; Emission abatement; Global emission pathways; Mitigation costs; Emission trading; Consumption loss; Adaptation costs; Residual damage; | ||
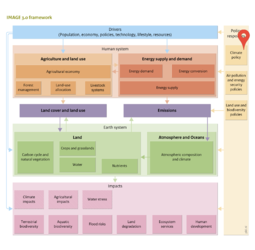
|Description= | |Description=<div class=“version newv31”>With the 2015 Paris Agreement, all Parties to the United Nations Framework Convention on Climate Change (UNFCCC) have agreed to limit global warming to 2 °C compared to pre-industrial levels and to pursue efforts to further limit this increase further to a maximum of 1.5 °C [[UNFCCC (2015b)]]</div>. To achieve this goal, countries have proposed short- and long-term reduction targets in the {{abbrTemplate|UNFCCC}} climate negotiating process and in domestic policies. To support climate policymakers, the IMAGE model is used in conjunction with the climate policy model [[FAIR model|FAIR]]. FAIR is a decision support tool to analyse the costs, benefits, and climate effects of mitigation regimes, emission reduction commitments, and climate policies. | ||
</div>. To achieve this goal, countries have proposed short- and long-term reduction targets in the {{abbrTemplate|UNFCCC}} climate negotiating process and in domestic policies. To support climate policymakers, the IMAGE model is used in conjunction with the climate policy model [[FAIR model|FAIR]]. FAIR is a decision support tool to analyse the costs, benefits, and climate effects of mitigation regimes, emission reduction commitments, and climate policies. | |||
FAIR can work in stand-alone mode using exogenous data, but in recent applications it interacts with several IMAGE components. For instance, mitigation cost curves for the energy sector are derived from the [[Energy supply and demand|Energy Supply and Demand model TIMER]] and land-use mitigation options from [[Agriculture and land use|Agriculture and Land Use]]. Data from FAIR on marginal abatement costs and reduction efforts per sector and greenhouse gases are used as input for IMAGE to evaluate the impacts under different assumptions for climate mitigation. | FAIR can work in stand-alone mode using exogenous data, but in recent applications it interacts with several IMAGE components. For instance, mitigation cost curves for the energy sector are derived from the [[Energy supply and demand|Energy Supply and Demand model TIMER]] and land-use mitigation options from [[Agriculture and land use|Agriculture and Land Use]]. Data from FAIR on marginal abatement costs and reduction efforts per sector and greenhouse gases are used as input for IMAGE to evaluate the impacts under different assumptions for climate mitigation. | ||
Revision as of 18:35, 4 November 2016
| Component is implemented in: |
|
| Related IMAGE components |
| Models/Databases |
| Key publications |
| References |
Key policy issues
- What global greenhouse gas emissions pathways would meet the well below 2 °C climate target?
- What is the effect of effort-sharing approaches on regional and national emission reduction targets and on the cost of climate policies?
- What is the effect of the NDCs on achieving the long term 2 ºC target?
- What are the trade-offs between mitigation costs, adaptation costs, and climate change damage?