Drivers/Policy issues: Difference between revisions
m (Text replace - "|Status=On hold" to "") |
Dafnomilii (talk | contribs) (Changed based on Detlef's input) |
||
| (19 intermediate revisions by 3 users not shown) | |||
| Line 1: | Line 1: | ||
{{DriverPartTemplate | {{DriverPartTemplate | ||
|PageLabel=Policy issues | |||
|Sequence=4 | |||
|Reference=Moss et al., 2010; Van Vuuren et al., 2012; Ebi et al., 2014a; Lutz and KC, 2010; Dellink et al., 2017; KC and Lutz, forthcoming; IIASA, 2013; | |||
}}<div class="page_standard"> | |||
<h2>Baseline developments </h2> | |||
Under baseline conditions, scenario drivers are assumed to develop either along the pathway considered the ‘best guess’ translation of current trends into the future, or multiple contrasting scenarios are considered to explore the range of plausible future trends. The first approach has been chosen for many studies, such as the OECD Environmental Outlook to 2050 ([[OECD, 2012]]), as starting point for policy interventions to improve the baseline outcomes within and across sectors and issues. The second approach recognizes structural uncertainties in how the world may develop, and explores how such uncertainties would play out in a future range of outcomes. Multiple contrasting scenarios also serve to investigate how robust policy interventions play out under different future conditions. Examples of multiple baseline studies are the Special Report on Emissions Scenarios ([[IPCC, 2000]]) and the Millennium Ecosystem Assessment ([[MA, 2005]]). | |||
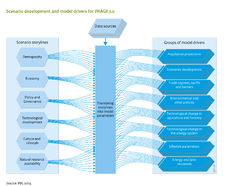
| | Recently, the Shared Socioeconomic Pathways ({{AbbrTemplate|SSP}}s) have been developed to support climate change research by different research communities ([[Moss et al., 2010]]; [[Van Vuuren et al., 2012]]; [[Ebi et al., 2014a]]). See both Figures below. The qualitative narratives or storylines characterizing alternative futures are essential elements of the SSPs From there, assumptions are made about internally coherent sets of scenario drivers, and key model drivers, such as population and {{AbbrTemplate|GDP}} growth ([[IIASA, 2013]]) | ||
===Population and socio-economic projections=== | |||
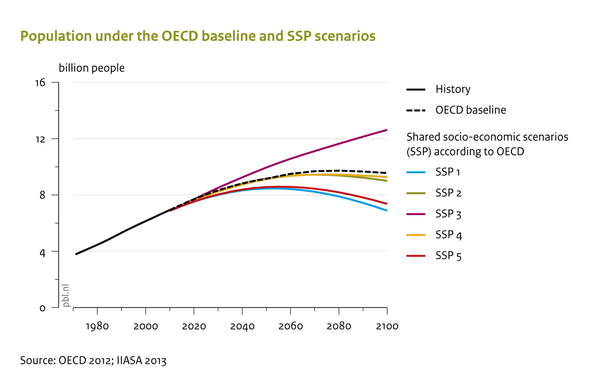
The wide range of long-term populations projections is presented in the figure below. By 2100, the world population could be either about the same as today or double. The projections were made by IIASA using a population modelling approach ([[Lutz and KC, 2010]]) that links aggregate education levels to fertility and mortality rates per country. Together with migration flows, these rates determine the size of the future population. ([[Dellink et al., 2017]]; [[KC and Lutz, forthcoming]]). | |||
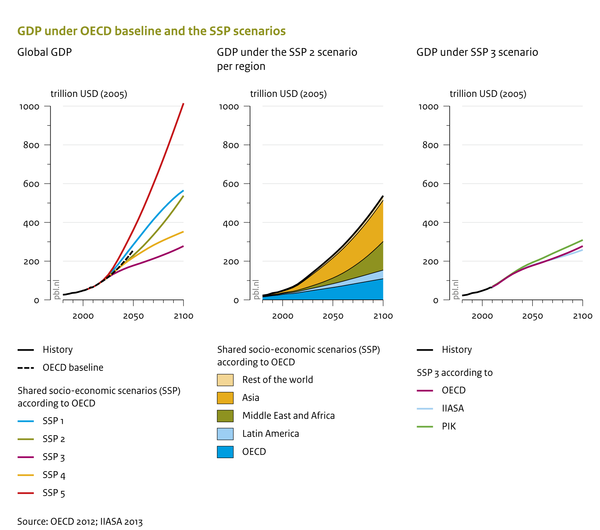
Using population projections and the underlying educational attainment per age cohort, long-term economic growth models project economic development expressed as GDP per capita. For the SSPs, economic development up to 2100 has been calculated by three different teams at [[OECD]], [[IIASA]] and [[PIK]], using their own models. GDP projections from the OECD model [[ENV-Growth model|ENV-Growth]] ([[Dellink et al., 2017]]) differ by a factor of up to 3.7 (see the figure at the bottom, left). The differences in population and economic growth rates between countries and regions mean that the distribution of total economic assets is likely to shift, with Asia in the lead, followed later by Africa and, to a lesser extent, by Latin America (see the figure at the bottom, middle). | |||
In the last few years, the population and socio-economic projects have been updated using the latest historical data. Subsequently, the relative growth from the original scenarios is applied to the last year for which data is available. For economic data, the COVID-crisis was implemented using the historical data for 2020 and projections (from the IMF) in the near term (until 2023). | |||
=== | === Models, scenario story lines and results=== | ||
Different models have been used to investigate how different model structures, assumptions, and interpretations of the qualitative scenario storylines in model parameters lead to quite different results (see the figure at the bottom, right). Projections for the SSP3 scenario made by different teams differ concerning the levels projected for 2100 and respect to the profile over the century. | |||
For more information on baseline scenarios in economic, social and ecological terms, see the results obtained in the IMAGE 3.0 framework in the 'Policy issues' pages of the [[Framework overview|Components]]. | |||
{{DisplayPolicyInterventionFigureTemplate|{{#titleparts: {{PAGENAME}}|1}}|Baseline figure}} | |||
==Policy interventions== | |||
Once baseline scenarios are implemented, modifications can be made at various levels to reflect policy interventions diverging from the trends emerging under baseline conditions. These modifications can vary depending on the subject, scale, timeframe and policy levers under consideration, for instance, reducing climate change impacts, reducing the nutrient loading of coastal waters, slowing down the rate of biodiversity loss, and reducing water stress. These and many other options to alleviate anticipated future problems have been explored with IMAGE. More information on policies, instruments and goals is provided in the 'Policy issue' pages of the [[Framework overview|Components]]. The [[Policy interventions and components overview]] shows a list of all policy interventions and their affected components. | |||
{{DisplayPolicyInterventionFigureTemplate|{{#titleparts: {{PAGENAME}}|1}}|Policy intervention figure}} | |||
</div> | |||
}} | |||
Latest revision as of 12:06, 8 October 2021
Parts of Drivers/Policy issues
| Projects/Applications |
| Models/Databases |
| Relevant overviews |
| Key publications |
| References |
Baseline developments
Under baseline conditions, scenario drivers are assumed to develop either along the pathway considered the ‘best guess’ translation of current trends into the future, or multiple contrasting scenarios are considered to explore the range of plausible future trends. The first approach has been chosen for many studies, such as the OECD Environmental Outlook to 2050 (OECD, 2012), as starting point for policy interventions to improve the baseline outcomes within and across sectors and issues. The second approach recognizes structural uncertainties in how the world may develop, and explores how such uncertainties would play out in a future range of outcomes. Multiple contrasting scenarios also serve to investigate how robust policy interventions play out under different future conditions. Examples of multiple baseline studies are the Special Report on Emissions Scenarios (IPCC, 2000) and the Millennium Ecosystem Assessment (MA, 2005).
Recently, the Shared Socioeconomic Pathways (SSPs) have been developed to support climate change research by different research communities (Moss et al., 2010; Van Vuuren et al., 2012; Ebi et al., 2014a). See both Figures below. The qualitative narratives or storylines characterizing alternative futures are essential elements of the SSPs From there, assumptions are made about internally coherent sets of scenario drivers, and key model drivers, such as population and GDP growth (IIASA, 2013)
Population and socio-economic projections
The wide range of long-term populations projections is presented in the figure below. By 2100, the world population could be either about the same as today or double. The projections were made by IIASA using a population modelling approach (Lutz and KC, 2010) that links aggregate education levels to fertility and mortality rates per country. Together with migration flows, these rates determine the size of the future population. (Dellink et al., 2017; KC and Lutz, forthcoming).
Using population projections and the underlying educational attainment per age cohort, long-term economic growth models project economic development expressed as GDP per capita. For the SSPs, economic development up to 2100 has been calculated by three different teams at OECD, IIASA and PIK, using their own models. GDP projections from the OECD model ENV-Growth (Dellink et al., 2017) differ by a factor of up to 3.7 (see the figure at the bottom, left). The differences in population and economic growth rates between countries and regions mean that the distribution of total economic assets is likely to shift, with Asia in the lead, followed later by Africa and, to a lesser extent, by Latin America (see the figure at the bottom, middle).
In the last few years, the population and socio-economic projects have been updated using the latest historical data. Subsequently, the relative growth from the original scenarios is applied to the last year for which data is available. For economic data, the COVID-crisis was implemented using the historical data for 2020 and projections (from the IMF) in the near term (until 2023).
Models, scenario story lines and results
Different models have been used to investigate how different model structures, assumptions, and interpretations of the qualitative scenario storylines in model parameters lead to quite different results (see the figure at the bottom, right). Projections for the SSP3 scenario made by different teams differ concerning the levels projected for 2100 and respect to the profile over the century.
For more information on baseline scenarios in economic, social and ecological terms, see the results obtained in the IMAGE 3.0 framework in the 'Policy issues' pages of the Components.
Policy interventions
Once baseline scenarios are implemented, modifications can be made at various levels to reflect policy interventions diverging from the trends emerging under baseline conditions. These modifications can vary depending on the subject, scale, timeframe and policy levers under consideration, for instance, reducing climate change impacts, reducing the nutrient loading of coastal waters, slowing down the rate of biodiversity loss, and reducing water stress. These and many other options to alleviate anticipated future problems have been explored with IMAGE. More information on policies, instruments and goals is provided in the 'Policy issue' pages of the Components. The Policy interventions and components overview shows a list of all policy interventions and their affected components.