Ecosystem services/Description: Difference between revisions
Oostenrijr (talk | contribs) No edit summary |
Oostenrijr (talk | contribs) m (Text replacement - "==Model description of {{ROOTPAGENAME}}==" to "") |
||
| Line 3: | Line 3: | ||
}} | }} | ||
<div class="page_standard"> | <div class="page_standard"> | ||
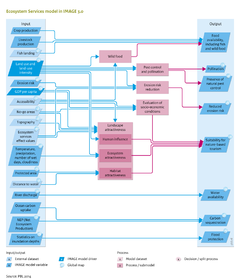
The supply of ecosystem services is quantified using other models in the IMAGE 3.0 framework, and where necessary combined with relationships between environmental variables and ecosystem services supply, derived from literature reviews (Figure Flowchart). | The supply of ecosystem services is quantified using other models in the IMAGE 3.0 framework, and where necessary combined with relationships between environmental variables and ecosystem services supply, derived from literature reviews (Figure Flowchart). | ||
Latest revision as of 15:34, 1 April 2020
Parts of Ecosystem services/Description
Model description of Ecosystem services
The supply of ecosystem services is quantified using other models in the IMAGE 3.0 framework, and where necessary combined with relationships between environmental variables and ecosystem services supply, derived from literature reviews (Figure Flowchart).
Ecosystem services derived directly from other IMAGE models include the food provision from agricultural systems; water availability; carbon sequestration; and flood protection. Estimation of the services, wild food provision, erosion risk reduction, pollination, pest control and attractiveness for nature-based tourism, requires additional environmental variables and relationships (Maes et al., 2012; Schulp et al., 2012). A key variable for these services is fine-scale land use intensity data from the GLOBIO model.
The supply of ecosystem services can be evaluated and aggregated in several ways. Some studies have constructed hotspot maps based on the number of services delivered (Egoh et al., 2008; Egoh et al., 2009; O'Farrell et al., 2010). Others translate service provision into monetary values for ecosystems (Costanza et al., 1997; TEEB, 2010b; UNEP-WCMC, 2011).
The main shortcoming of hotspot maps and monetising is the lack of information whether sufficient ecosystem services are delivered to fulfil human requirements (Burkhard et al., 2012). Here, the service supply is compared to the potential requirement (minimum quantity required by humans) in order to assess surpluses and deficiencies. This translates into minimum quantities of food and water to stay healthy, or the minimum quantity of natural elements in a landscape to potentially pollinate all crops. The relation between supply and potential requirement is the ecosystem services budget. These budgets are relevant at different spatial scales, because some services can only be provided locally, while others (mainly goods) can be transported longer distances. The most relevant assessment scale for each ecosystem service was determined given the underlying modelling approaches (the table below).
| Category | Ecosystem service | Assessment scale |
|---|---|---|
| Provisioning services | Food from agro-ecosystems | IMAGE region |
| Wild food | Country, local market | |
| Fish | Country | |
| Wood | IMAGE region | |
| Water | River basin | |
| Regulating services | Carbon sequestration | Global |
| Erosion risk reduction | 0.5°x0.5° grid | |
| Pollination | 0.5°x0.5° grid | |
| Pest control | 0.5°x0.5° grid | |
| Flood protection | 30 sec x 30 sec grid | |
|
Provisioning services |
Cultural services |
0.5°x0.5° grid |
Cultural services
Food
Food supply is broken down into three components: food produced on agricultural land (crops and livestock); fish from marine fish landings and aquaculture; and wild food from hunting and gathering. The food supply is converted to energy content (kcal nutritional value) and proteins (g) provided by the aggregate agricultural products, fish and wild food, and summed per IMAGE geographical region.
Agricultural ecosystems are modified by human interventions such as mechanisation, fertiliser application, irrigation, and agro-chemicals for pest and disease control. The degree of modification varies significantly between agricultural production systems, from slight in an extensive grazing system to heavy in modern agriculture (Van Asselen et al., 2013). Even in the most heavily modified systems, the production of crops and livestock depends on ecological processes in agricultural ecosystems.
For crops and livestock products, data from the IMAGE crop and livestock module are used (Components Agriculture and land use and Nutrients). Production volumes are modified for products used as feed and for post-harvest losses to estimate the food quantity consumed by humans. Marine fish landings per country are derived from the Sea around Us project (Sea around us project, 2013). The amount of fish derived from aquaculture is not yet included due to data limitations. Wild food can be an important part of local diets and includes game, mushrooms and berries. Local availability depends on the land cover and natural productivity of the ecosystem, and is determined from national and international hunting statistics for each land cover type (EFI, 2007; Schulp et al., 2012). Accessibility also influences availability of the wild food, and depends on the time people spend in collection including travel time (Nelson, 2008).
The potential food requirement is estimated by multiplying the minimum amount of energy and protein required per year on average to stay healthy (FAO, 2013b) and by the number of inhabitants per IMAGE geographic region.
The budget is determined by subtracting the regional requirement from the total regional supply, indicating whether regional ecosystems supply sufficient food to meet the human requirement. The Ecosystem service ‘food’ relates to average numbers over a large population with very different standards of living, and access to affordable and healthy food. Therefore, even if total supply equals or exceeds demand, a larger or smaller proportion of the population in the region may suffer from malnutrition or hunger.
Water
Water availability is essential for natural vegetation, agricultural production, human settlements and industry. The renewable water supply is the water availability in a river basin and is derived from the IMAGE hydrology module (Component Water). The water surplus of each grid cell is aggregated to watersheds to form river discharge. These flows are influenced by dams and reservoirs for irrigation and/or for hydropower production (Biemans et al., 2011).
The water requirement is also derived from the IMAGE hydrology module (Component Water), and is determined by adding together water use for agriculture (irrigation and livestock), industry, electricity and for domestic purposes in each river basin (Alcamo et al., 2003).
The budget is illustrated by the water stress in each river basin as the ratio of average annual water demand and supply (Vörösmarty et al., 2000). According to literature, medium water stress is indicated when >20% of the available water is extracted, and is considered severe when more than 40% of the available water is extracted. The ecosystem services ‘water’is considered to be sufficiently supplied when there is less than medium water stress, below 20% extraction (Vörösmarty et al., 2000).
Regulating services
Carbon sequestration
CO2 emissions are a key driver of climate change. By halting the increase of CO2 concentration in the atmosphere, the consequences of global warming could be limited in the longer term. Natural vegetation and oceans can sequester CO2 from the atmosphere and thus influence CO2 concentration.
The amount of CO2 sequestered by vegetation and oceans is considered an ecosystem service. A proxy for CO2 sequestration by vegetation is net ecosystem production (NEP), which is the difference between net primary productivity (NPP) and plant and soil respiration. NEP values and ocean sequestration are adopted from IMAGE (Section Carbon cycle and natural vegetation and Atmospheric composition and climate). The supply values are averaged over ten years to account for year to year model fluctuation (Crossman et al., 2013).
Total CO2 emissions from all sources would need to be sequestered to prevent increase in CO2 concentration. Thus, the service requirement is the total CO2 emissions from industry, energy and land use change (agriculture, deforestation and fires) from IMAGE, also averaged over ten years. The budget is established by subtracting emissions from CO2 sequestered.
Erosion risk reduction
Erosion is the loss of topsoil by wind and water, and is a natural process. However, agricultural practices can accelerate erosion rates, reducing productivity and leading to loss of arable land. The model considers topsoil erosion related to water and agricultural practices (Component Land degradation).
The erosion risk depends on topography, precipitation and agricultural practices, including crop type (see Component Land degradation). The risk can be reduced by natural vegetation serving as buffer zones, erosion prevention strips and uphill soil retention cover. To determine the supply of ecosystem services, the erosion risk index from IMAGE is linearly reduced by the percentage of natural elements in a grid cell, derived from the land use and intensity map from GLOBIO (see Component Land degradation).
Erosion prevention is needed in all cultivated areas. The ecosystem services budget indicates whether natural vegetation is sufficient to protect the area from erosion risk. According to (Hootsmans et al., 2001), an erosion index value greater than 0.15 indicates moderate erosion risk, and an index value in excess of 0.30 indicates high erosion risk. It is assumed the ecosystem services are adequate when the nature-corrected index value is below 0.15.
Pollination
Pollination is required for fruit setting for a large variety of oil crops, pulses and fruits. Pollinator-dependent crops require insects such as bees, bumblebees and flies, but also bats and birds (Gallai et al., 2009). To secure adequate pollination for such crops, sufficient habitat for wild pollinators is needed. The abundance of pollinators is shown to decrease with decreasing percentage of natural elements, which reduces the pollination efficiency and yield (Steffan-Dewenter and Tscharntke, 1999; Kleijn and Langevelde, 2006; Schulp et al., 2012).
The supply of this ecosystem service is derived from the relationship between the percentage of nature in a grid cell and the percentage of pollinator-dependent yield produced (Morandin et al., 2007; Klein et al., 2011; Schulp and Alkemade, 2011). Only yield produced by wild pollinators is included, but in practice yield is also influenced by managed- and self-pollination. When a grid cell contains 60% of nature, there are sufficient wild pollinators for all the plants and thus 100% of pollinator dependent yield is produced. However, when the percentage of nature decreases to 20% per grid cell, wild pollinators can still sustain 90% of pollinator-dependent yield. Less than 20% nature in a grid cell causes a sharp decline in yield (Morandin et al., 2007). Pollination is only needed in croplands, and we assume that in grid cells containing cropland and at least 20% of natural elements pollination is sufficient.
The budget is the cropland area with sufficient natural elements, and divided by the total cropland area.
Pest control
Natural pest control reduces pest occurrence in agriculture fields as a result of the presence of predator species (Thies et al., 2003; Boccaccio and Petacchi, 2009; Rusch et al., 2011). This leads to higher yields than in fields without natural or technical pest control. Natural pest control requires sufficient natural elements to house predator species close to agricultural fields. Pest control is assumed to be effective on agricultural fields within 2 km of forests and other natural elements (Bianchi et al., 2005). This can be translated into a correlation between the percentage of natural elements in a grid cell and the effectiveness of biological pest control (Thies et al., 2003; Boccaccio and Petacchi, 2009; Rusch et al., 2011).
Hawkins and Cornell (Hawkins and Cornell|1994) indicate that natural pest control is no longer successful when the percentage of pest insects killed falls below 32 to 36%. This corresponds with 37 to 43% of nature in a grid cell. The model does not consider natural pest control by soil fauna present in the field.
The supply of natural pest control is determined by the percentage of nature in a grid cell All cropland is assumed to potentially require effective natural pest control. The pest control budget is calculated by dividing the cropland area in cells with more than 40% of natural elements by the total cropland area.
Flood protection
Flooding is the most frequent and costly natural hazard, affecting most countries worldwide on a regular basis (UNISDR, 2011; IPCC, 2012). Therefore, flood risk assessment is an important issue for policymakers. While there are different levels of flood risk, the risk most often used by policymakers is the100-year flood event which indicates a flood event occurring with a 1% likelihood in every year (Bell and Tobin, 2007). Protection against 100-year flood events, but not against less likely events, is considered a reasonable compromise between protecting the public and overly stringent regulation.
The flood risk is taken from the model GLOFRIS, which combines the flood extent and depth of river and coastal flood events, (Component Flood risks).
Vegetation and soil affect inundation extent and depth because upstream vegetation can retain water and reduce flood risks. To calculate reduction in flood risk by ecosystems, flood risk is determined for a situation without conversion of natural vegetation and compared to flood risk in the current situation. The requirements for the service flood protection is estimated as the the depth of the 100-year flood event with the historical land use, vegetation and soil type. The budget illustrates whether change in vegetation and soil increases or decreases flood protection on urban and cultivated areas. Since the spatial variability of flood risk may be large, the 100-year flood event and the cultivated and urban areas are determined in 30x30 arcsec grid cells. The budget is aggregated to 0.5°x0.5° grid cell.
Cultural services
Nature-based tourism
The ecosystem service “nature-based tourism” is rather complex and there is limited knowledge about this service on a global scale. Drawing upon expert knowledge, we have listed several indicators influencing the supply of nature-based tourism (Van Kolck et al., in preparation). To be able to provide one single indicator for the ecosystem service supply, the indicators were grouped into three categories:
- an esthetic factor based on the climate-dependent tourism comfort index, scenic quality, land cover, and relief;
- a habitat factor based on distance to river, coasts, waterfalls and lakes, and the amount of protected area;
- a deterrent factor based on extent of urban and cultivated area, accessibility, rate of traffic disturbances, GDP and safety.
The three groups of indicators are normalized between 0-1 and summed to form one single supply indicator.
In the absence of expert judgment, it was not possible to estimate a demand for nature based tourism. Hence, to indicate whether the ecosystem service supply meets a certain level, and to determine an ecosystem service budget, we have set an arbitrary threshold at 1.40. The budget is the area in grid cells with an index value above 1.40, divided by the total area.
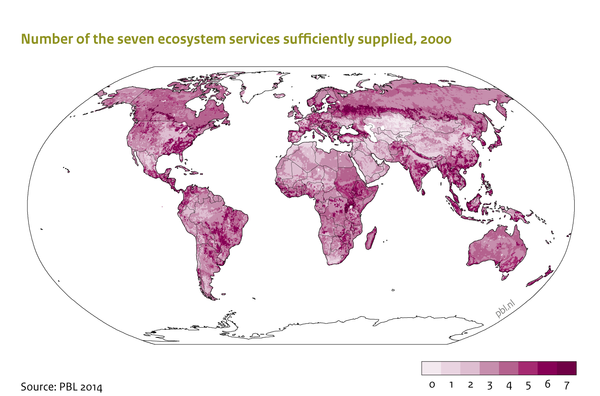
Aggregation
To aggregate ecosystem services, the budget of each service is set to a binary scale. Where zero indicates a service is not sufficiently delivered or not requested, and one indicates the supply meets the requirement, and thus is sufficiently delivered. These ecosystem service budgets on a binary scale can be summed to indicate the number of services sufficiently delivered in each grid cell.