Energy demand: Difference between revisions
m (Text replace - "Demand for electricity and hydrogen" to "Demand for electricity, heat and hydrogen") |
Dafnomilii (talk | contribs) No edit summary |
||
| (20 intermediate revisions by 4 users not shown) | |||
| Line 1: | Line 1: | ||
{{ComponentTemplate2 | {{ComponentTemplate2 | ||
|Application=Resource | |Application=Roads from Rio+20 (2012) project; EU Resource efficiency (2011) project; ADVANCE project; | ||
|IMAGEComponent= | |IMAGEComponent=Drivers; Human development; Forest management; | ||
|KeyReference=Daioglou et al., 2012; Girod et al., 2012; Van Ruijven et al., 2012; | |KeyReference=Daioglou et al., 2012; Girod et al., 2012; Van Ruijven et al., 2012; | ||
|InputVar=GDP per capita; Sector value added; Private consumption; Population; Energy intensity parameters; Energy efficiency technology; Primary energy price; Electricity price; Lifestyle parameters; | |InputVar=GDP per capita; Sector value added; Private consumption; Population; Energy intensity parameters; Energy efficiency technology; Primary energy price; Electricity price; Lifestyle parameters; Taxes and other additional costs; Preferences; Secondary energy price | ||
|Parameter=Exogenously set market shares; | |||
|OutputVar= | |OutputVar=Demand for electricity, heat and hydrogen; Demand traditional biomass; People dependent on solid fuel; Energy and industry activity level; Demand for fossil fuels and bioenergy; | ||
|HasPageLabel=Introduction page | |||
|ComponentCode=ED | |ComponentCode=ED | ||
|AggregatedComponent=Energy supply and demand | |AggregatedComponent=Energy supply and demand | ||
|FrameworkElementType=pressure component | |FrameworkElementType=pressure component | ||
}} | }} | ||
<div class="page_standard"> | |||
Global energy use has increased rapidly since the industrial revolution. From a historical perspective, most increases have occurred in high-income regions but more recently, the largest increase is in emerging economies. With the aspirations for income growth in medium- and low-income countries, energy demand is expected to grow in the coming decades, with major implications for sustainability goals. | |||
<h3>Energy demand sectors and processes</h3> | |||
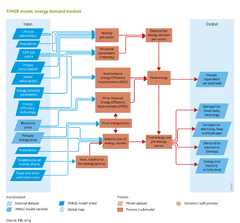
In the TIMER energy demand module, final energy demand is simulated as a function of changes in population, economic activity and energy intensity (see flowchart). Five economic sectors are considered: industry; transport; residential; public and private services; and other sectors mainly agriculture. In each sector, final energy use is driven by the demand for energy services, such as motor drive, mass displacement, chemical conversions, lighting, heating and cooling. Energy demand is considered as a function of three groups of parameters and processes: | |||
*activity data, for example on population and income, and more explicit activity indicators, such as steel production; | |||
*long-term trends that determine the intensity of use, for example, economic structural change ({{abbrTemplate|SC}}), autonomous energy efficiency improvement ({{abbrTemplate|AEEI}}) and price-induced energy efficiency improvement ({{abbrTemplate|PIEEI}}); | |||
*price-based fuel substitution ( the choice of energy carrier on the basis of its relative costs). | |||
These factors are implemented in different ways in the various sectors. In some sectors, a detailed end-use service-oriented modelling approach is used while in other sectors, the description is more generic and aggregate. Energy prices link the demand module with other parts of the energy model, as they respond dynamically to changes in demand, supply and conversion. | |||
{{InputOutputParameterTemplate}} | |||
</div> | |||
Latest revision as of 12:58, 22 November 2021
| Component is implemented in: |
|
| Related IMAGE components |
| Projects/Applications |
| Key publications |
Key policy issues
- How will energy demand evolve particularly in emerging and medium- and low-income economies?
- What is the mix of end-use energy carriers to meet future energy demand?
- How can energy efficiency contribute to reducing the growth rate of energy demand and mitigate pressures on the global environment?
Introduction
Global energy use has increased rapidly since the industrial revolution. From a historical perspective, most increases have occurred in high-income regions but more recently, the largest increase is in emerging economies. With the aspirations for income growth in medium- and low-income countries, energy demand is expected to grow in the coming decades, with major implications for sustainability goals.
Energy demand sectors and processes
In the TIMER energy demand module, final energy demand is simulated as a function of changes in population, economic activity and energy intensity (see flowchart). Five economic sectors are considered: industry; transport; residential; public and private services; and other sectors mainly agriculture. In each sector, final energy use is driven by the demand for energy services, such as motor drive, mass displacement, chemical conversions, lighting, heating and cooling. Energy demand is considered as a function of three groups of parameters and processes:
- activity data, for example on population and income, and more explicit activity indicators, such as steel production;
- long-term trends that determine the intensity of use, for example, economic structural change (SC), autonomous energy efficiency improvement (AEEI) and price-induced energy efficiency improvement (PIEEI);
- price-based fuel substitution ( the choice of energy carrier on the basis of its relative costs).
These factors are implemented in different ways in the various sectors. In some sectors, a detailed end-use service-oriented modelling approach is used while in other sectors, the description is more generic and aggregate. Energy prices link the demand module with other parts of the energy model, as they respond dynamically to changes in demand, supply and conversion.
Input/Output Table
Input Energy demand component
| IMAGE model drivers and variables | Description | Source |
|---|---|---|
| Private consumption | Private consumption reflects expenditure on private household consumption. It is used in IMAGE as a driver of energy. | Drivers |
| Population | Number of people per region. | Drivers |
| Energy intensity parameters | Set of parameters determining the energy use per unit of economic activity (in absence of technical energy efficiency improvements). | Drivers |
| Lifestyle parameters | Lifestyle parameters influence the relationship between economic activities and demand for energy. | Drivers |
| Energy efficiency technology | Model assumptions determining future development of energy efficiency. | Drivers |
| Taxes and other additional costs | Taxes on energy use, and other additional costs | Drivers |
| GDP per capita | Gross Domestic Product per capita, measured as the market value of all goods and services produced in a region in a year, and is used in the IMAGE framework as a generic indicator of economic activity. | Drivers |
| Preferences | Non-price factors determining market shares, such as preferences, environmental policies, infrastructure and strategic considerations, used for model calibration. | Drivers |
| Sector value added | Value Added for economic sectors: Industry (IVA), Services (SVA) and Agriculture (AVA). These variables are used in IMAGE to indicate economic activity. | Drivers |
| Secondary energy price | The secondary energy price of each energy carrier at the end-use level (coal, oil, gas, bio-energy, electricity, hydrogen) is calculated based on (1) the primary energy price, (2) energy taxes and subsidies, (3) the costs of energy conversion throughout the energy supply chain and (4) a correction factor. | Energy conversion |
| Primary energy price | The price of primary energy carriers based on production costs. | Energy supply |
| Electricity price | The price of electricity. | Energy conversion |
| External datasets | Description | Source |
|---|---|---|
| Exogenously set market shares | Market shares of traditional biomass and secondary heat, for all demand sectors except the residential sector, exogenous scenario parameter. | IEA |
Output Energy demand component
| IMAGE model variables | Description | Use |
|---|---|---|
| Demand traditional biomass | Regional demand for traditional bioenergy. | |
| Energy and industry activity level | Activity levels in the energy and industrial sector, per process and energy carrier, for example, the combustion of petrol for transport or the production of crude oil. | |
| Demand for electricity, heat and hydrogen | The demand for production of electricity, heat and hydrogen. | |
| People dependent on solid fuel | Proportion of population using traditional biomass and coal for cooking and heating. | |
| Demand for fossil fuels and bioenergy | The demand for the production of fossil fuels and bioenergy. | Final output |