Energy demand/Policy issues: Difference between revisions
No edit summary |
Sluisveldvm (talk | contribs) No edit summary |
||
| (24 intermediate revisions by 5 users not shown) | |||
| Line 1: | Line 1: | ||
{{ | {{ComponentPolicyIssueTemplate | ||
| | |Reference=Van den Berg et al., 2011; Van Ruijven et al., 2007; | ||
}} | |||
[[ | <div class="page_standard"> | ||
==Baseline developments== | |||
The model shows that under a typical baseline scenario such as the one of the [[Roads from Rio+20 (2012) project|Rio+20]] study, energy demand is projected to grow significantly during the 21st century. Most growth will be driven by an increase in energy use in low-income countries. Per capita use in high-income countries is projected to remain more or less constant, consistent with recent historical trends. The increase in energy demand in the first half of the century will be mostly met by fossil fuels and electricity. In this model simulation, hydrogen becomes competitive in the transport sector in the second half of the century, as a result of increasing oil prices and the assumed progress in hydrogen technologies. An alternative assumption could result in a similar role for electricity. | |||
{{DisplayPolicyInterventionFigureTemplate|{{#titleparts: {{PAGENAME}}|1}}|Baseline figure}} | |||
==Policy interventions== | ==Policy interventions== | ||
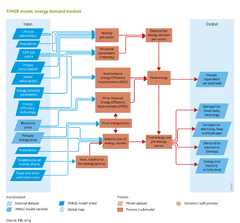
Various policy interventions can be implemented in the energy demand submodules in different ways (see also the Policy interventions Table below): | |||
* Energy tax and carbon tax. This changes the prices for the energy carriers influences the choice of technology. | |||
* Discount rate/payback time. In the residential submodule , the perceived costs of capital (discount rate) influence the extent of energy efficiency improvement (PIEEI) and the choice of fuel and/or technology in the residential submodule. | |||
* Preferences. Fuel choice can be influenced by correction factors, representing aspects that influence fuel choice but are not incorporated in the price, such as fuel characteristics (e.g., cleanliness, availability), comfort and speed considerations, and infrastructure. | |||
* Efficiency standards. Such improvements can be introduced for the submodules that focus on specific technologies, for example, in transport, heavy industry and households. | |||
* Enforced market shares of fuel types. Such an analysis could, for instance, provide insight into the implications in the model of increasing the use of biofuels, electricity or hydrogen ([[Van Ruijven et al., 2007]]). | |||
{{PIEffectOnComponentTemplate }} | |||
</div> | |||
[[ | |||
Latest revision as of 15:22, 22 May 2019
Parts of Energy demand/Policy issues
| Component is implemented in: |
|
| Related IMAGE components |
| Projects/Applications |
| Key publications |
| References |
Baseline developments
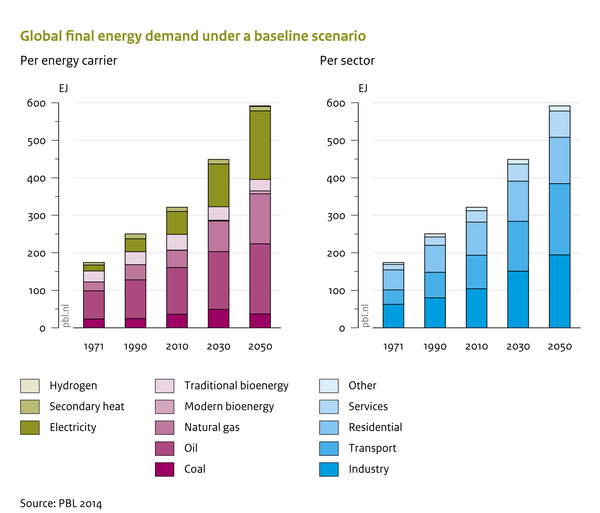
The model shows that under a typical baseline scenario such as the one of the Rio+20 study, energy demand is projected to grow significantly during the 21st century. Most growth will be driven by an increase in energy use in low-income countries. Per capita use in high-income countries is projected to remain more or less constant, consistent with recent historical trends. The increase in energy demand in the first half of the century will be mostly met by fossil fuels and electricity. In this model simulation, hydrogen becomes competitive in the transport sector in the second half of the century, as a result of increasing oil prices and the assumed progress in hydrogen technologies. An alternative assumption could result in a similar role for electricity.
Policy interventions
Various policy interventions can be implemented in the energy demand submodules in different ways (see also the Policy interventions Table below):
- Energy tax and carbon tax. This changes the prices for the energy carriers influences the choice of technology.
- Discount rate/payback time. In the residential submodule , the perceived costs of capital (discount rate) influence the extent of energy efficiency improvement (PIEEI) and the choice of fuel and/or technology in the residential submodule.
- Preferences. Fuel choice can be influenced by correction factors, representing aspects that influence fuel choice but are not incorporated in the price, such as fuel characteristics (e.g., cleanliness, availability), comfort and speed considerations, and infrastructure.
- Efficiency standards. Such improvements can be introduced for the submodules that focus on specific technologies, for example, in transport, heavy industry and households.
- Enforced market shares of fuel types. Such an analysis could, for instance, provide insight into the implications in the model of increasing the use of biofuels, electricity or hydrogen (Van Ruijven et al., 2007).
Effects of policy interventions on this component
| Policy intervention | Description | Effect |
|---|---|---|
| Carbon tax (*) | A tax on carbon leads to higher prices for carbon intensive fuels (such as fossil fuels), making low-carbon alternatives more attractive. | The higher fossil fuel prices result in a shift towards less carbon-intensive energy carriers and (assuming a higher overall energy price) more energy efficiency. There can also be changes in end-use technologies ( e.g. electric cars in the transport sector, blast furnaces with CCS to produce iron and steel). |
| Change market shares of fuel types (*) | Exogenously set the market shares of certain fuel types. This can be done for specific analyses or scenarios to explore the broader implications of increasing the use of, for instance, biofuels, electricity or hydrogen and reflects the impact of fuel targets. (Reference:: Van Ruijven et al., 2007) | The share of the fuel in final energy consumption will be at least equal to the target. |
| Change the use of electricity and hydrogen | It is possible to promote the use of electricity and hydrogen at the end-use level. | An increase in the use of electricity and hydrogen at the end use level. Given the high flexibility in the choice of feedstock in electricity and hydrogen production this can increase the ability of the total system to reduce greenhouse gas emissions in a mitigation scenario. |
| Improving energy efficiency (*) | Exogenously set improvement in efficiency. Such improvements can be introduced for the submodels that focus on particular technologies, for example, in transport, heavy industry and households submodels. | More efficient use of final energy, change in end use technologies, which leads to lower energy demand. |
| Provision on improved stoves for traditional bio-energy (*) | Increases the efficiency of bio-energy use. | Reduces demand for bio-energy. |
| Subsidies on modern energy (*) | Reduces the costs of modern energy to reduce traditional energy use (can be targeted to low income groups). | Reduces traditional energy use, while increasing modern energy use. |