File:Dataflow overview impact components digraph impact components dot.png: Difference between revisions
Jump to navigation
Jump to search
Oostenrijr (talk | contribs) (generated by the GraphViz extension from the Dataflow overview - impact components page) |
Oostenrijr (talk | contribs) (Oostenrijr uploaded a new version of File:Dataflow overview impact components digraph impact components dot.png) |
(No difference)
| |
Latest revision as of 10:24, 19 July 2017
ImageMap
When including this image in a wiki page, use the following mark-up to enable links:
<imagemap>
File:Dataflow_overview___impact_components_digraph_impact_components_dot.png
rect 484 1378 649 1418 [[Access to drinking water and sanitation]]
rect 259 1261 398 1299 [[Human development]]
rect 513 1437 620 1475 [[Child mortality]]
rect 504 1494 629 1532 [[Child underweight]]
rect 500 1068 632 1124 [[DALYs (disability-adjusted life years)]]
rect 480 1143 653 1184 [[HDI (human development index)]]
rect 511 1203 621 1241 [[Life expectancy]]
rect 491 1260 642 1300 [[People living on less then USD 1.25 per day]]
rect 505 1319 628 1359 [[Prevalence of undernourishment]]
rect 494 157 639 196 [[Algal blooms in lakes]]
rect 261 126 396 164 [[Aquatic biodiversity]]
rect 499 100 634 138 [[Aquatic MSA - grid]]
rect 20 319 171 359 [[Land cover  land use - grid]]
rect 288 576 369 614 [[Flood risks]]
rect 269 318 388 356 [[Land degradation]]
rect 254 916 403 954 [[Terrestrial biodiversity]]
rect 24 125 166 165 [[N and P discharge to surface water - grid]]
rect 23 60 167 98 [[River discharge - grid]]
rect 721 764 851 802 [[Ecosystem services]]
rect 932 542 1083 582 [[Carbon sequestration - grid]]
rect 933 601 1081 639 [[Flood protection - grid]]
rect 930 659 1084 715 [[Food availability  including fish and wild food]]
rect 949 734 1065 773 [[Pollination - grid]]
rect 928 792 1086 832 [[Presence of natural pest control - grid]]
rect 932 851 1083 891 [[Reduced erosion risk - grid]]
rect 932 910 1083 966 [[Suitability for nature-based tourism - grid]]
rect 928 986 1086 1024 [[Water availability - grid]]
rect 511 260 621 300 [[Change in soil properties - grid]]
rect 505 319 628 357 [[Erosion risk - grid]]
rect 32 513 158 551 [[Precipitation - grid]]
rect 32 434 159 472 [[Temperature - grid]]
rect 497 1551 636 1589 [[Livestock production]]
rect 27 790 163 829 [[Protected area - grid]]
rect 497 1608 636 1646 [[Ocean carbon uptake]]
rect 497 1665 636 1706 [[NEP (net ecosystem production) - grid]]
rect 510 1725 622 1763 [[Crop production]]
rect 491 949 642 989 [[Land use and land-use intensity - grid]]
rect 24 674 166 712 [[GDP per capita - grid]]
rect 10 222 181 260 [[Number of wet days - grid]]
rect 508 1782 625 1820 [[Cloudiness - grid]]
rect 488 457 645 497 [[Statistics on inundation depth - grid]]
rect 488 575 645 615 [[Expected nr of affected people - grid]]
rect 500 634 632 674 [[Expected value of affected GDP - grid]]
rect 489 693 644 733 [[Statistics of inundation extent - grid]]
rect 505 516 628 556 [[Statistics on river discharge - grid]]
rect 38 969 153 1007 [[Population - grid]]
rect 24 1260 166 1300 [[Food availability per capita]]
rect 39 1319 152 1357 [[GINI coefficient]]
rect 42 1376 148 1414 [[GDP per capita]]
rect 24 1433 166 1473 [[People dependent on solid fuel]]
rect 12 1492 179 1530 [[Urban population fraction]]
rect 4 1146 186 1184 [[BC  OC and NOx emissions]]
rect 43 1203 147 1241 [[SO2 emissions]]
rect 497 1008 636 1048 [[MSA (mean species abundance) - grid]]
rect 494 833 639 873 [[SRI (species richness index) - grid]]
rect 494 892 639 930 [[Wilderness area - grid]]
rect 20 851 171 891 [[Management intensity crops]]
rect 20 910 171 950 [[Management intensity livestock]]
rect 23 1083 167 1123 [[Nitrogen deposition - grid]]
rect 13 1026 178 1064 [[Global mean temperature]]</imagemap>
See ImageMap for more information.
File history
Click on a date/time to view the file as it appeared at that time.
| Date/Time | Thumbnail | Dimensions | User | Comment | |
|---|---|---|---|---|---|
| current | 11:09, 23 March 2020 | 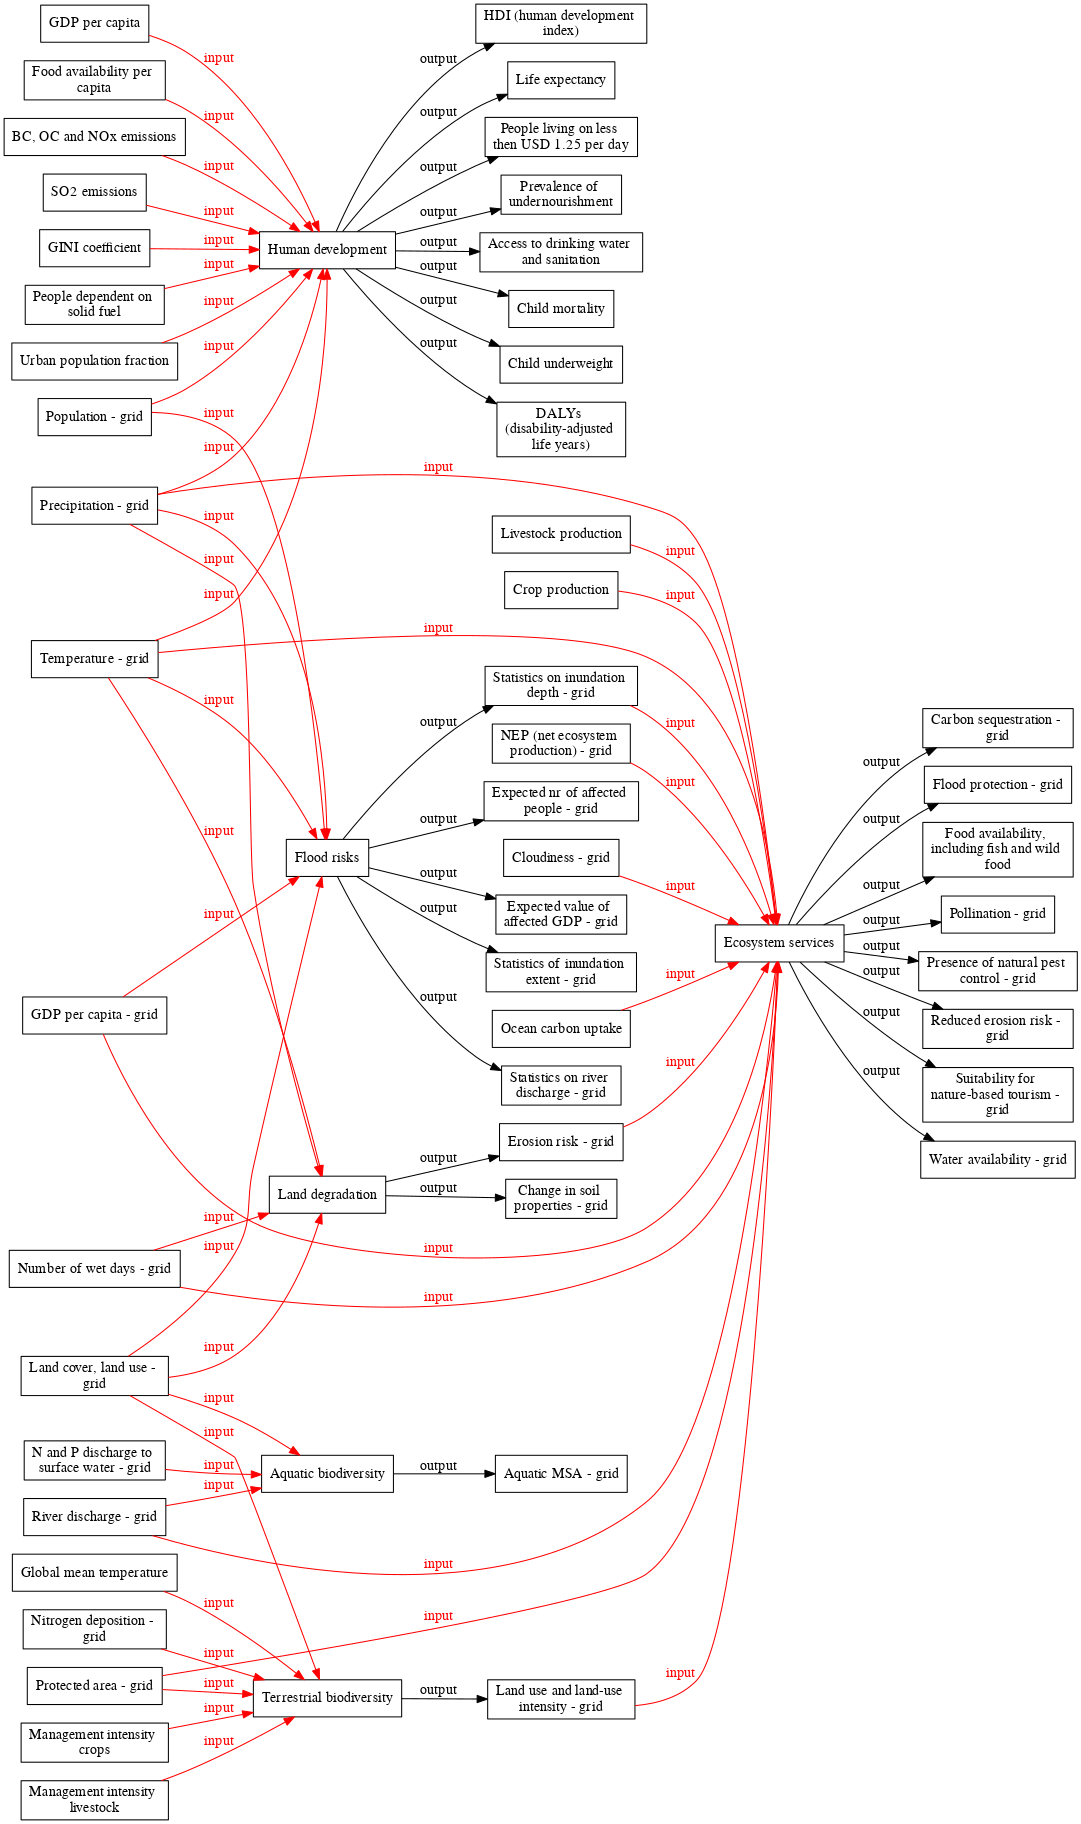 | 1,081 × 1,824 (295 KB) | Oostenrijr (talk | contribs) | |
| 16:46, 20 March 2020 | 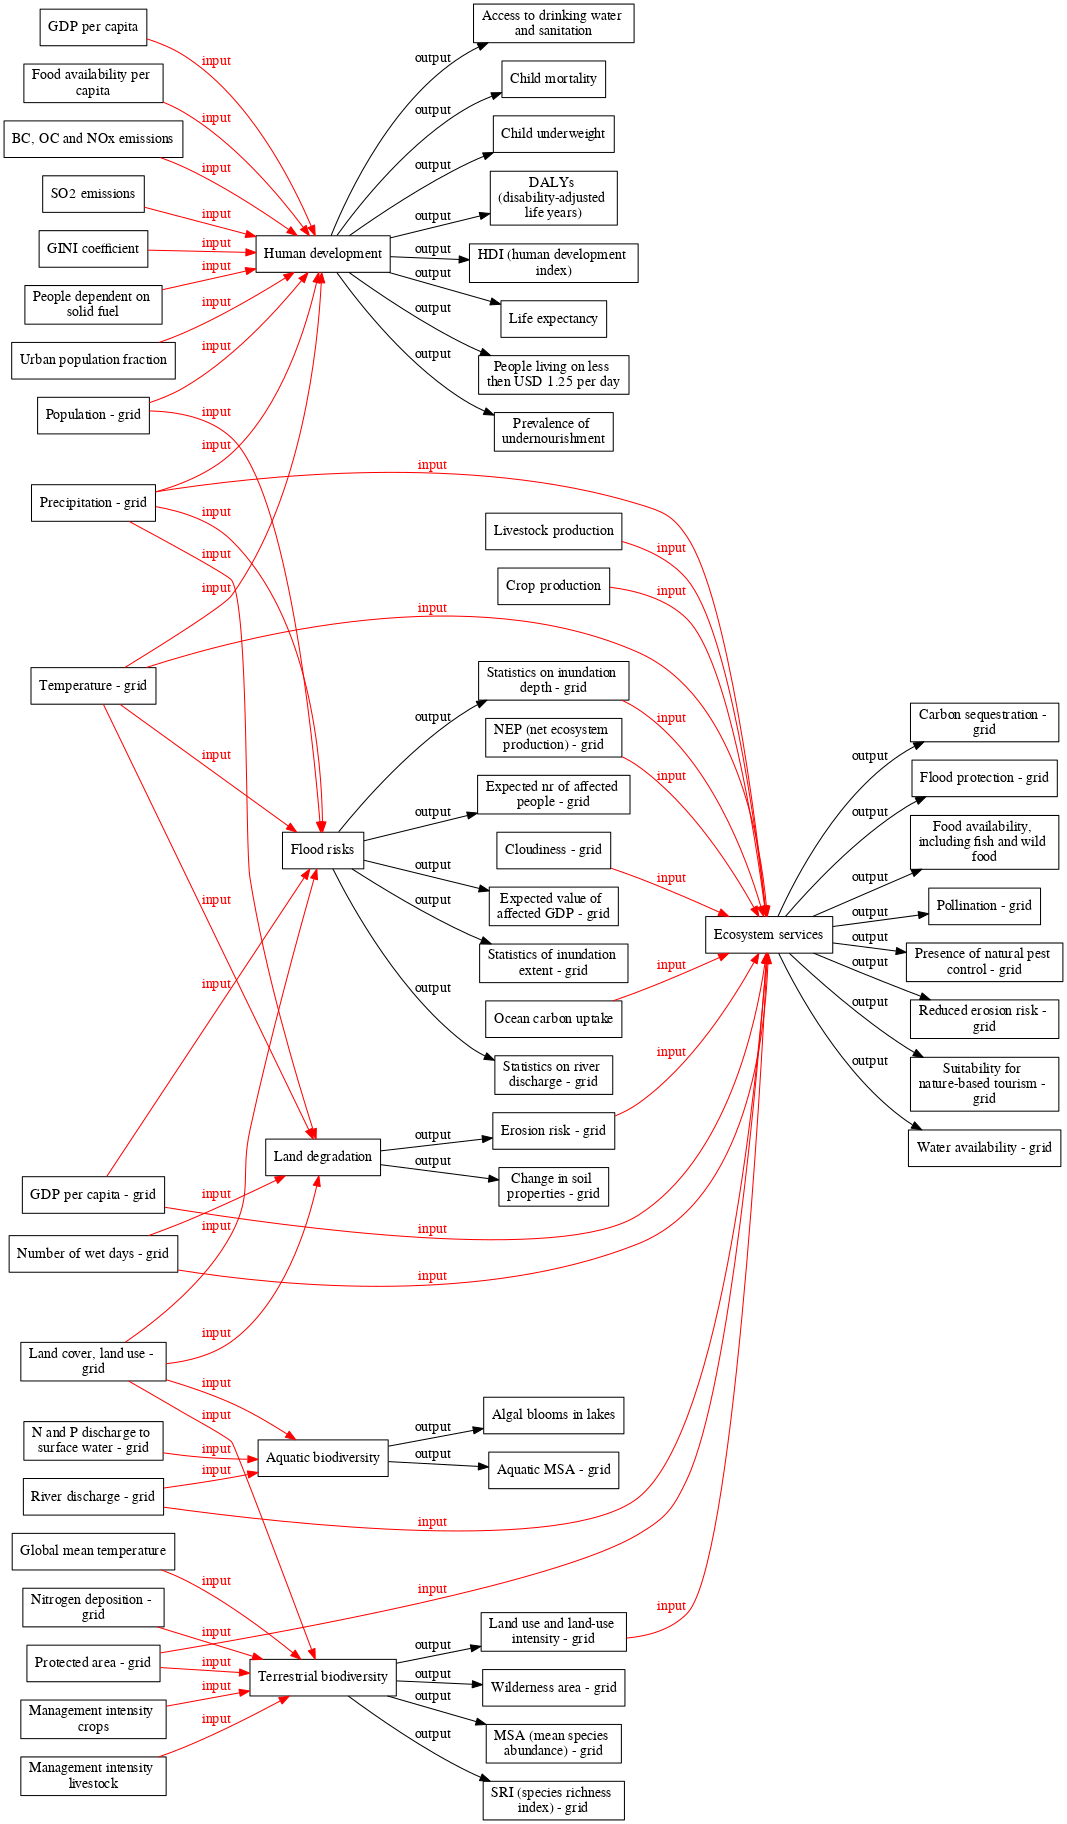 | 1,067 × 1,824 (311 KB) | Graphviz (talk | contribs) | ||
| 15:39, 20 March 2020 | 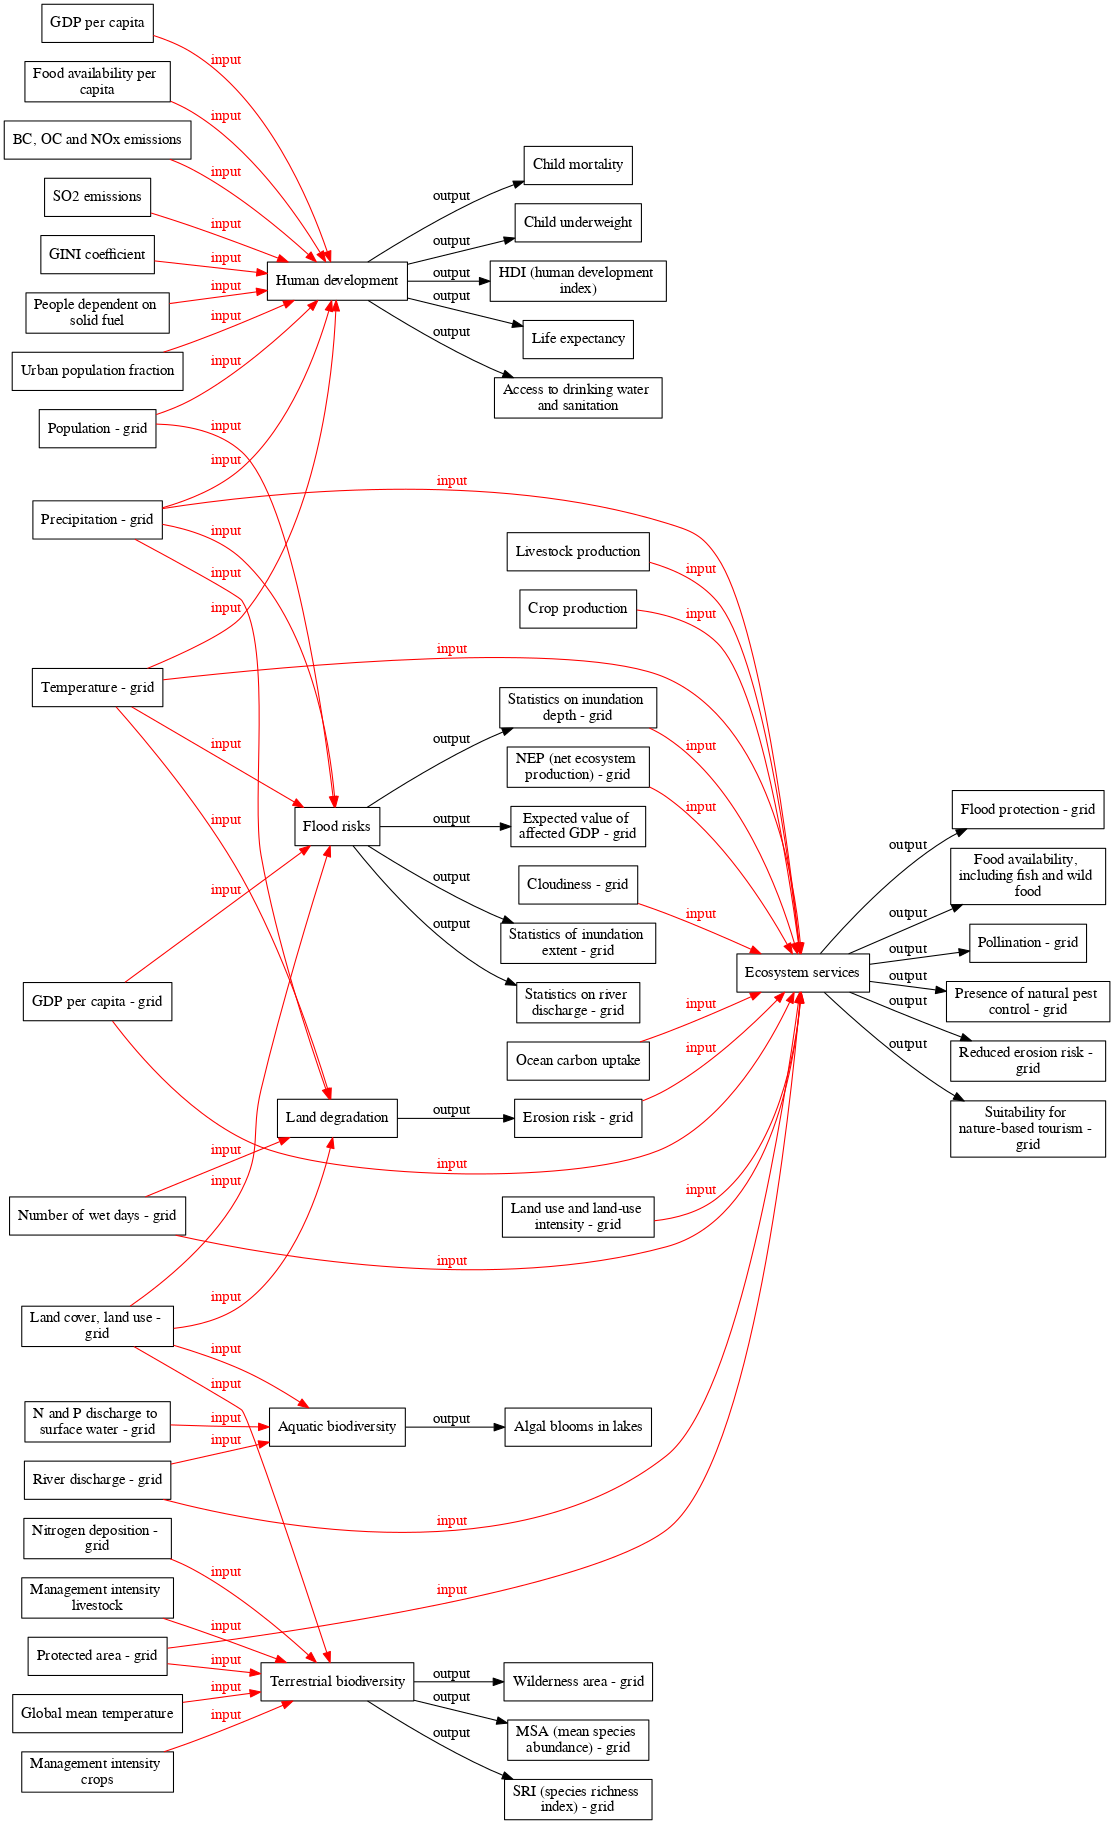 | 1,114 × 1,824 (275 KB) | Graphviz (talk | contribs) | ||
| 14:56, 20 March 2020 | 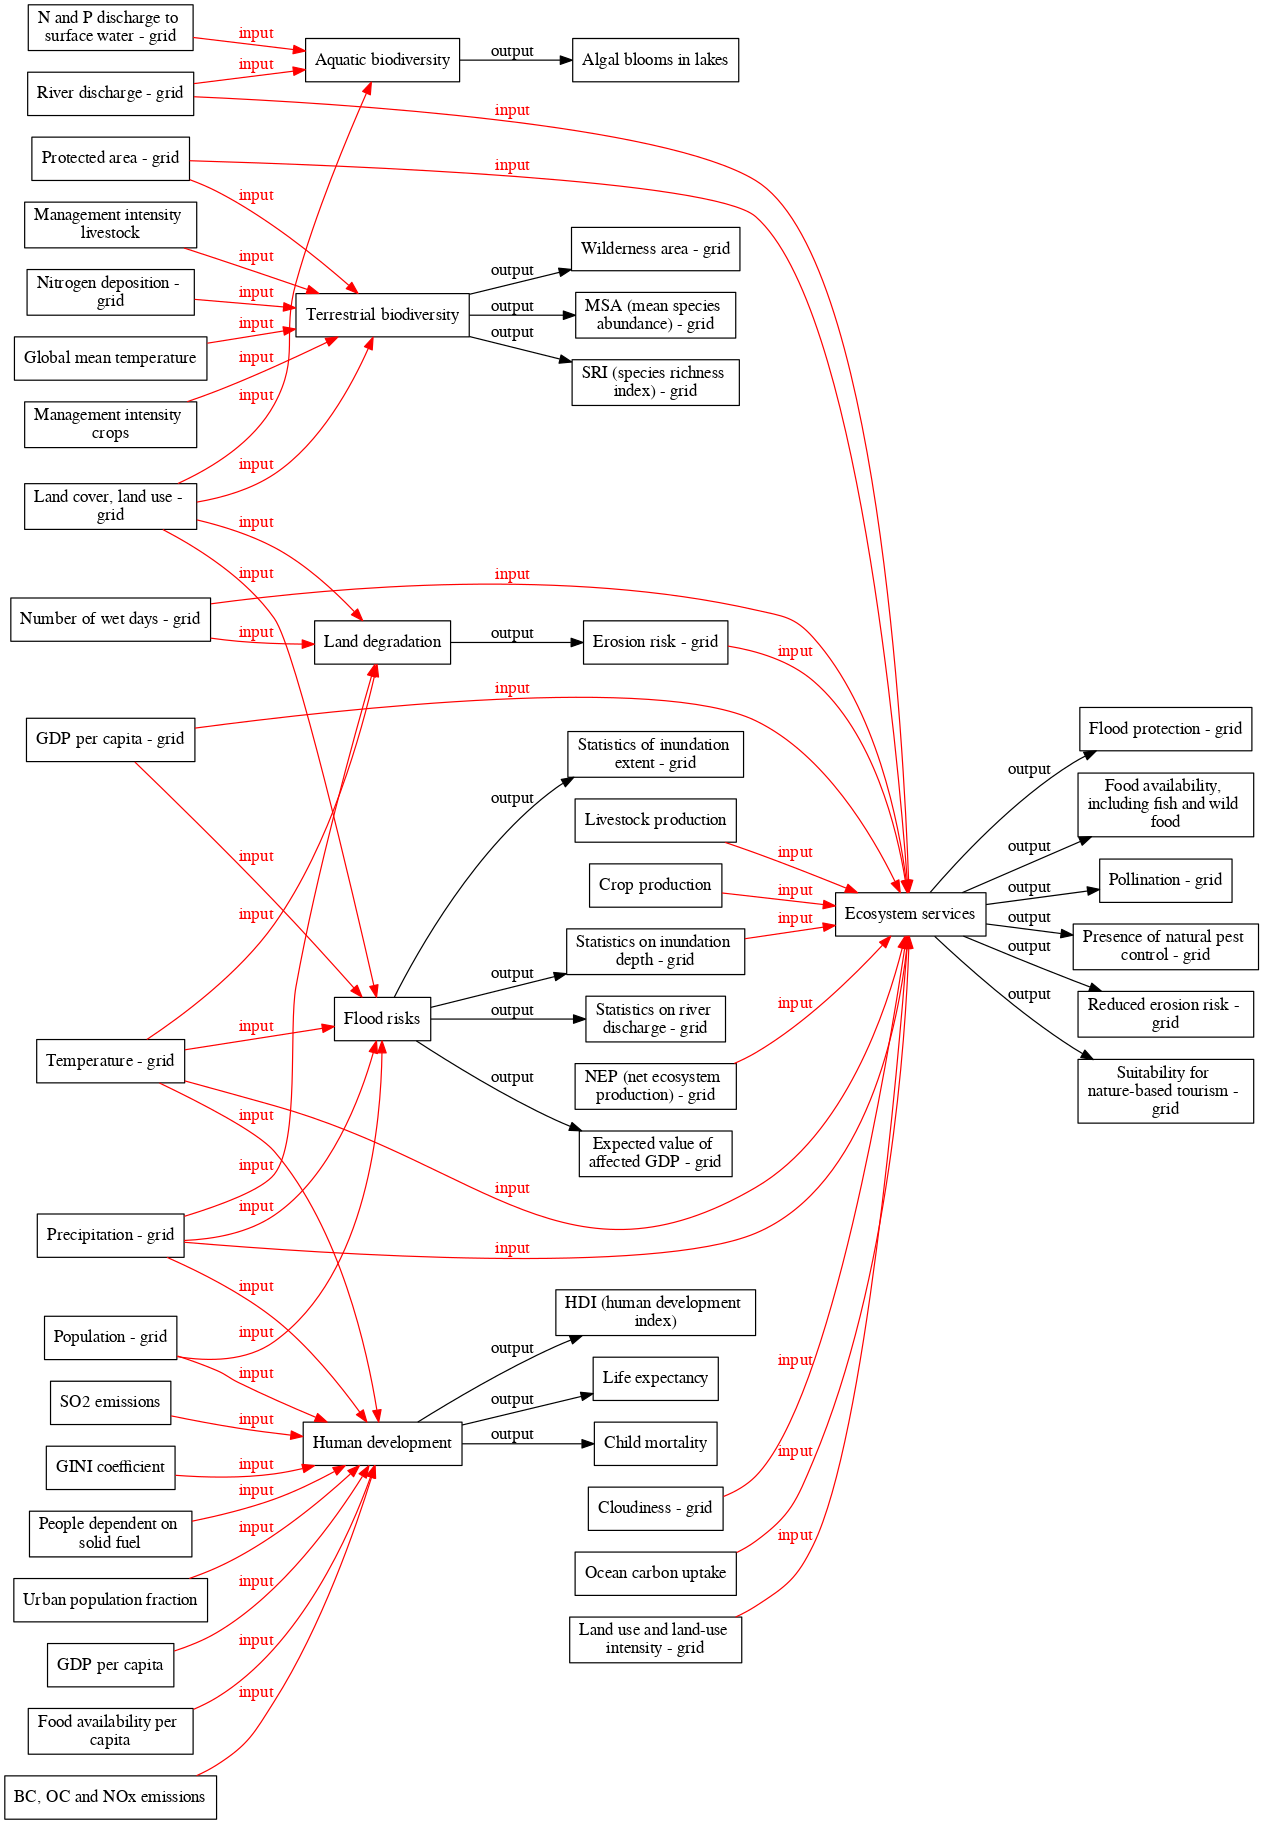 | 1,263 × 1,824 (314 KB) | Graphviz (talk | contribs) | ||
| 15:01, 10 March 2020 | 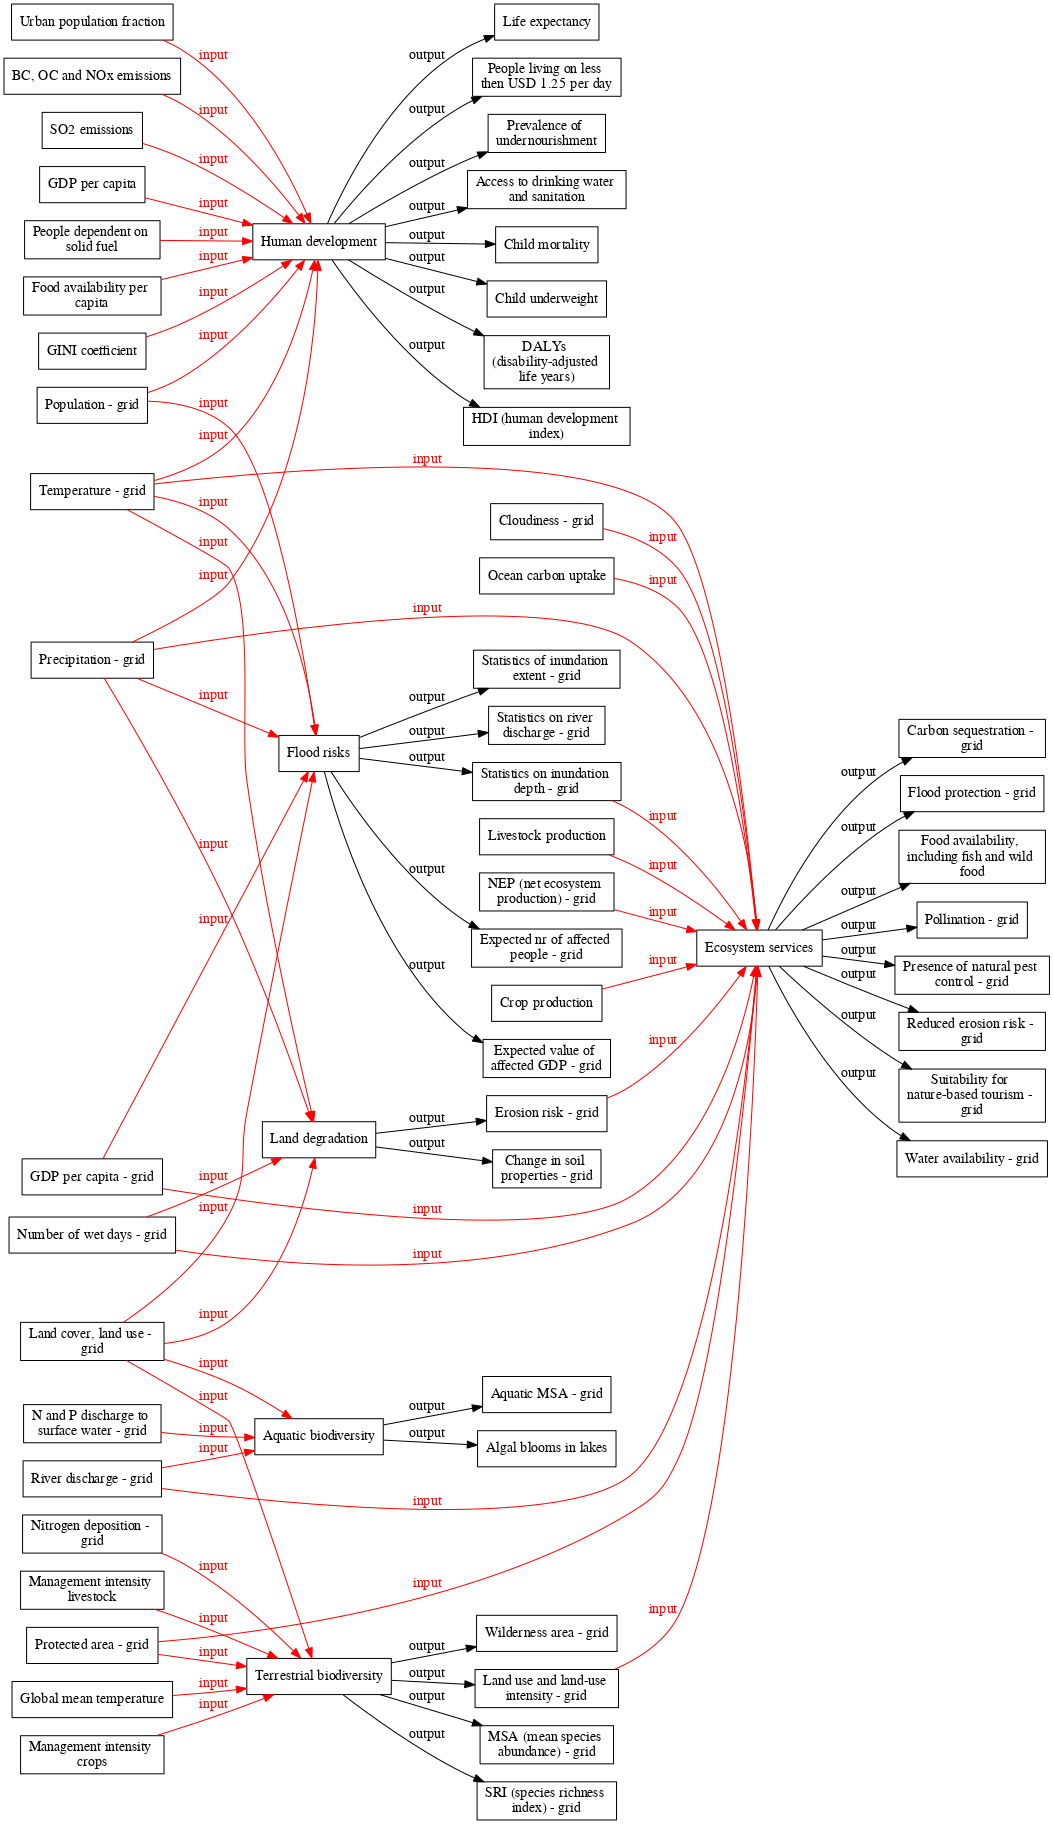 | 1,053 × 1,824 (306 KB) | Oostenrijr (talk | contribs) | ||
| 10:24, 19 July 2017 |  | 1,091 × 1,824 (310 KB) | Oostenrijr (talk | contribs) | generated by the GraphViz extension from the Dataflow overview - impact components page | |
| 10:23, 19 July 2017 | 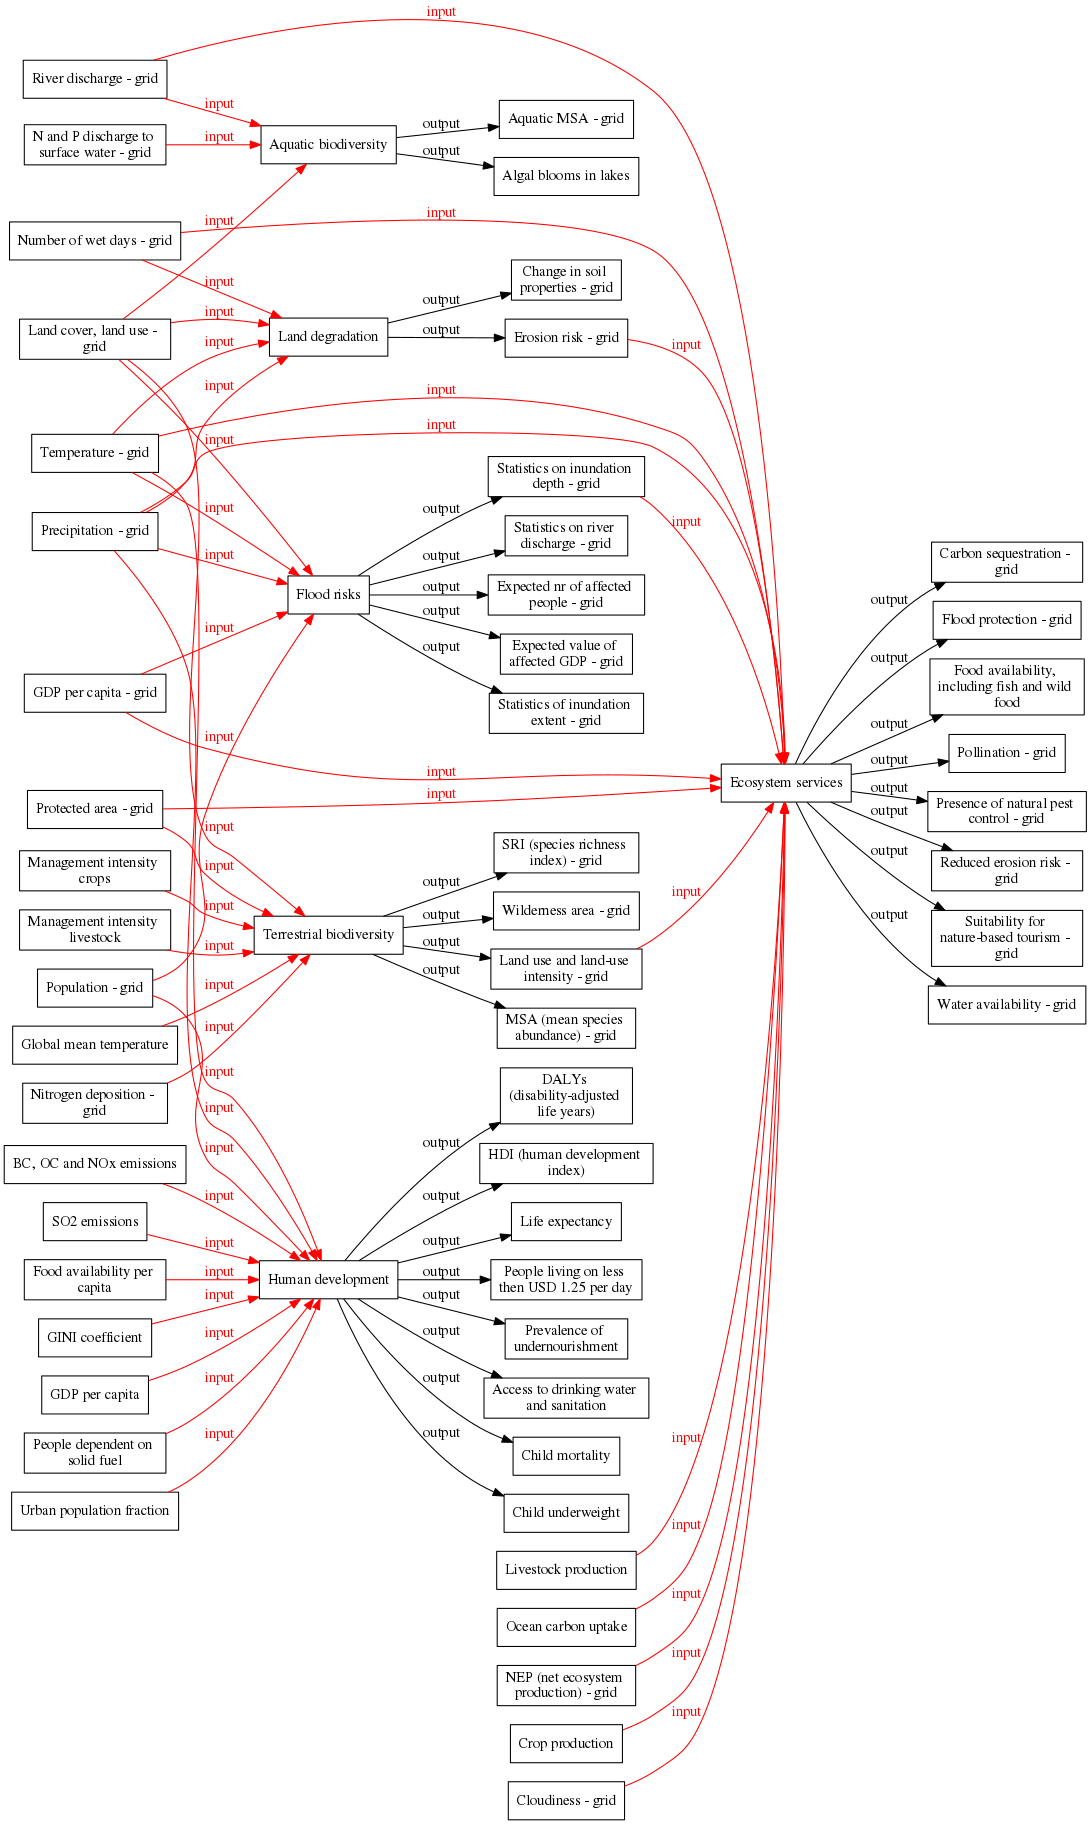 | 1,091 × 1,824 (310 KB) | Oostenrijr (talk | contribs) | generated by the GraphViz extension from the Dataflow overview - impact components page |
You cannot overwrite this file.
File usage
The following page uses this file: