Human development/Data uncertainties limitations: Difference between revisions
Jump to navigation
Jump to search
No edit summary |
No edit summary |
||
| (14 intermediate revisions by 3 users not shown) | |||
| Line 1: | Line 1: | ||
{{ComponentDataUncertaintyAndLimitationsTemplate | {{ComponentDataUncertaintyAndLimitationsTemplate | ||
|Reference=FAO, 2012a; WHO/UNICEF, 2012; Hutton and Haller, 2004; Hutton et al., 2006; WHO, 2009; World Bank, 2009; Chen and Ravallion, 2008; Ackah et al., 2009; Lutz et al., 2007; FAO, 2001b; WHO/UNICEF, 2012; | |||
|Reference=FAO, | |Description=<h2>Data, uncertainties and limitations</h2> | ||
===Data=== | |||
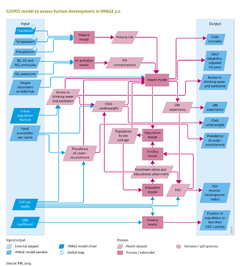
The model | Most data used in GISMO originate from specific UN institutions or the [[World Bank database| World Bank]]: | ||
* Per-capita food intake and coefficient of variation ([[FAO, 2012a]]); | |||
* Region-specific sex-age energy requirements ([[FAO, 2001b]]); | |||
* Access to safe drinking water and basic sanitation ([[WHO/UNICEF, 2012]]); | |||
* People using solid fuels and improved biomass stoves ([[Hutton et al., 2006]]); | |||
* Health risks and disease burden ([[WHO, 2009]]); | |||
* Health and education expenditures ([[World Bank, 2009]]); | |||
* Poverty data ([[Chen and Ravallion, 2008]]) ; | |||
* GINI coefficients ([[Ackah et al., 2009]]); | |||
* Enrolment ratios per educational level ([[World Bank, 2009]]) ; | |||
* Educational attainment level ([[Lutz et al., 2007]]). | |||
===Uncertainties=== | |||
The broad range of issues addressed leads to a range of uncertainties. Only the data uncertainties related to access to food, water and energy and the related health risks are considered. | |||
Per-capita food intake is based on [[FAOSTAT database|FAOSTAT data]], applied as averages per region, in the first year, and extended into the future by using food consumption data from the agro-economic model [[MAGNET model|MAGNET]] (Component [[Agricultural economy]]). The trends in per-capita food availability use income elasticities for broad groups of crops and animal products, but these trends are not necessarily linked to physical limitations on consumption levels. For water and energy, aggregations of different technologies to broad groups mask the underlying heterogeneity, and thus lead to uncertainties in model behaviour. Improved access to water supply and sanitation encompasses a broad range of forms of connection, each of which is assumed to carry the same potential health risk. The same is the case for access to modern energy sources for cooking and heating that encompass a broad range of traditional fuel and fuel-stove combinations. Health impacts are based on exposure-response relationships, and these are assumed to be the same worldwide and to remain constant over time. Many parameters are based on cross-sectional relationships with per-capita GDP ({{abbrTemplate|PPP}}), making the outcomes heavily dependent on this parameter. | |||
===Limitations=== | |||
The model also has several limitations, and specifically limited representation of the heterogeneous characteristics within populations. In most cases, a population average combined with a stylised distribution function is applied. This may not fully represent the distributional aspects, as in reality many of these issues may be concentrated in particular populations, and, more importantly, these distribution functions do not change in the model over time, while they probably do in reality. | |||
Furthermore, although health service efficacy and school enrolment ratios are driven in the model by investments in health and education services, these investments are not restricted by a limit on total investments. Similarly, the investments in drinking water and sanitation are not made explicit in the model but are derived from achieved coverage. Thus, instead of analysing the effect of specific investments in health outcomes, analysis can only be done by using pre-determined what-if scenarios. | |||
}} | }} | ||
Revision as of 10:20, 20 May 2014
Parts of Human development/Data uncertainties limitations
| Component is implemented in: |
|
| Related IMAGE components |
| Projects/Applications |
| Models/Databases |
| Key publications |
| References |