Human development/Description: Difference between revisions
Jump to navigation
Jump to search
No edit summary |
No edit summary |
||
| Line 49: | Line 49: | ||
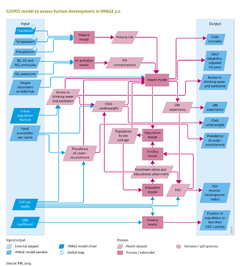
== GISMO poverty model == | == GISMO poverty model == | ||
In general, people are considered poor if their consumption or income levels fall below the level that is necessary to meet their basic needs, the ‘poverty line’. The poverty headcount (people living below the poverty line) is conducted by applying a log-normal distribution using per-capita income and a [[ | In general, people are considered poor if their consumption or income levels fall below the level that is necessary to meet their basic needs, the ‘poverty line’. The poverty headcount (people living below the poverty line) is conducted by applying a log-normal distribution using per-capita income and a [[GINI coefficient]] to describe its distribution over a population. The poverty module addresses people living below the international poverty lines of USD 1.25 and USD 2 per day, at 2005 PPP, as defined by the World Bank ([[Ravallion et al., 2008]]). | ||
== GISMO education model == | == GISMO education model == | ||
The education model addresses future developments in school enrolment and educational attainment, including literacy rates, for three levels of education: primary, secondary and tertiary. The model tracks the shares of the highest completed education and the average years of schooling per cohort. The enrolment ratios per educational level are determined, using cross-sectional relationships with per-capita GDP (PPP). The ages at which children attain a certain educational level are assumed to be equal across all regions. Literacy rates are simulated by the share of the population aged 15+, who have completed at least their primary education. Furthermore, to take account of autonomous increases in literacy levels, those of the population between the ages of 15 and 65 are increase by 0.3%, annually. | The education model addresses future developments in school enrolment and educational attainment, including literacy rates, for three levels of education: primary, secondary and tertiary. The model tracks the shares of the highest completed education and the average years of schooling per cohort. The enrolment ratios per educational level are determined, using cross-sectional relationships with per-capita GDP (PPP). The ages at which children attain a certain educational level are assumed to be equal across all regions. Literacy rates are simulated by the share of the population aged 15+, who have completed at least their primary education. Furthermore, to take account of autonomous increases in literacy levels, those of the population between the ages of 15 and 65 are increase by 0.3%, annually. | ||
}} | }} | ||
Revision as of 15:01, 17 December 2013
Parts of Human development/Description
| Component is implemented in: |
|
| Related IMAGE components |
| Projects/Applications |
| Models/Databases |
| Key publications |
| References |