Human development/Description: Difference between revisions

From IMAGE
Jump to navigation Jump to search
No edit summary
No edit summary
Line 50: Line 50:
Only the first three causes of mortality are considered because these are linked to environmental factors. The mortality rate due to a specific disease is a multiplication of the incidence rate (fraction of the population with the specific disease) and the case fatality rate (the fraction of people who die from a specific disease), distinguishing for the two sexes and five-year age cohorts. These mortality rates can then be used to calculated age-specific life expectancy (for details see [[Hilderink, 2000]]).


====Malaria risk=== =
====Malaria risk====
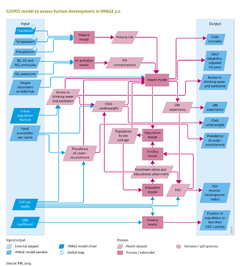
Incidence rates of malaria are determined by the areas suitable for the malaria mosquito, based on monthly temperature and precipitation, see Component [[Water]] ([[Craig et al., 1999]]). Incidence rates are decreased by the level of insecticide treated bed nets and indoor residual spraying, modelled separately as potential policy options. The case fatality rate of malaria is increased by level of underweight people and decreased by case management (treatment).


Line 71: Line 71:
The education module assesses future developments in school enrolment and educational attainment, including literacy rates at three levels of education: primary, secondary and tertiary. The model tracks the proportion of the highest level of education completed and the average number of years of schooling per cohort. The enrolment ratios per educational level are determined using cross-sectional relationships with per-capita GDP (PPP). The age at which a certain educational level is attained is assumed to be identical in all regions. Literacy rates are determined by the proportion of the population over the age of 15 who have completed at least primary education. Furthermore, to take account of autonomous increases in literacy levels, literacy levels of the population between the age of 15 and 65 is increased by 0.3%, annually.


Here, we only discuss the first three causes of mortality as they are linked to environmental factors (see Table). The mortality rate due to a specific disease is a multiplication of the incidence rate (fraction of the population with the specific disease) and the case fatality rate (the fraction of people who die from a specific disease), distinguishing for the two sexes and five-year age cohorts. These mortality rates can then be used to calculated age-specific life expectancy (for details see [[Hilderink, 2000]]).
Cause-specific deaths and risk factors of major communicable diseases:
*Malaria: Climate suitable for malaria vectors
*Protein deficiency: Prevalence of underweight
*Diarrhoea: Lack of safe drinking water and basic sanitation
*Pneumonia, chronic obstructive pulmonary disease (COPD) and lung cancer: Use of solid fuels (traditional biomass or coal) for cooking and heating
*Lung cancer, Cardiopulmonary diseases, Acute respiratory infections (ARI): Exposure to PM<sub>10</sub> and PM<sub>2.5</sub> related to NO<sub>x</sub>, SO<sub>2</sub> and black carbon emissions
=== Malaria risk ===
In the [[GISMO model]], incidence rates of malaria are determined by the areas which are suitable for the malaria mosquito, based on the monthly climatic factors of temperature and precipitation ([[Craig et al., 1999]]). Incidence rates are decreased by the level of insecticide treated bed nets and indoor residual spraying, modelled separately as potential policy options. The case fatality rate of malaria is increased by underweight levels and decreased by case management, i.e. treatment.
=== Access to food, water and energy ===
GISMO relates incidence and case fatality rates of major communicable (infectious) diseases to access to food, water and energy (see Table), with access defined by per-capita food availability, access to safe drinking water and improved sanitation, and access to modern energy sources for cooking and heating.
The per-capita food availability (Kcal/cap/day) is obtained from the [[Agricultural economy]] module.
The levels of access to safe drinking water and improved sanitation are modelled separately by applying linear regression. The explanatory variables include GDP per capita, urbanisation rate and population density. Developments in water supply are assumed to be implemented ahead of sanitation. As such, developments in access follow a pathway from no sustainable access to safe drinking water and basic sanitation, to improved water supply only, improved water supply and sanitation, household connection for water supply only, and to a household connection for watersupply and sanitation.
The level of access to modern energy sources for cooking and heating distinguishes between the use of traditional biomass and coal on traditional stoves; traditional biomass and coal on improved stoves; and the use of modern energy carriers (electricity, natural gas, LPG, kerosene, modern biofuels and decentralised renewable sources). Trends in access to modern energy sources are taken from the TIMER residential [[Energy demand]] model.
Child underweight and prevalence of undernourishment. For children under the age of five, undernourishment is expressed as underweight (measured as weight-for-age), whereas for older ages prevalence of undernourishment is used. The direct effect of undernourishment is protein deficiency, which for children mortality rates is scaled to their underweight status; for older age groups, mortality rates are scaled to levels of undernourishment. Indirectly, undernourishment increases the incidence of diarrhoea and pneumonia, and the case fatality of malaria, diarrhoea and pneumonia. These indirect effects are only modelled for children under the age of five.
Child underweight as a result of chronic undernourishment is modelled as a function of improvements in average food intake, the ratio of female to male life expectancy at birth, female enrolment in secondary education and access to clean drinking water ([[Smith and Haddad, 2000]]). Based on a normal distribution, the total number of underweight children is divided into three groups of mild, moderate and severe underweight ([[De Onis and Blossner, 2003]]).
The prevalence of undernourishment is calculated from per-capita food availability and the minimum energy requirements from FAO ([[FAO, 2003]]). The calculations use a lognormal distribution function determined by mean food consumption and a coefficient of variation. The coefficient of variation decreases over time as a function of per-capita GDP. Finally, the minimum dietary energy requirement is derived by aggregating region-specific sex-age energy requirements weighted by the proportion of each sex and age group in the total population, including a so-called pregnancy allowance.
Incidence rates of diarrhoea depend on the different levels of access to drinking water and sanitation facilities, child underweight levels and also on climate change. Case fatality rates are increased by underweight levels and decreased by the level of oral rehydration therapy.
Incidence rates of pneumonia, chronic obstructive pulmonary disease ([[HasAcronym::COPD]]) and lung cancer are increased by indoor air pollution caused by cooking and heating with traditional biomass and coal.
Simultaneously, incidence rates and case fatality rates are increased by child underweight levels.
=== Urban air pollution ===
Mortality rates of lung cancer, cardiopulmonary diseases and acute respiratory infections due to urban air pollution (i.e. PM10 and PM2.5 concentration levels) are derived by applying the [[HasAcronym::GBD]] methodology ([[Mathers and Loncar, 2006]]). Based on the emissions of NOx, SO2 and black carbon ([[Emissions]]), PM10 concentration levels are determined using the [[Global Urban Air quality Model]] (GUAM). GUAM originates from the GMAPS model ([[Pandey et al., 2006]]), which determines PM10 concentration levels by economic activity, population, urbanisation and meteorological factors. PM2.5 concentrations are obtained using a region-specific PM10–PM2.5 ratio. Based on these concentration levels and the exposed population, mortality attributable to the aforementioned causes of death is derived using relative risks. These relative risks have been obtained from epidemiological literature ([[Dockery et al., 1993]]; [[Pope et al., 1995]]).
== GISMO poverty model ==
In general, people are considered poor if their consumption or income levels fall below the level that is necessary to meet their basic needs, the ‘poverty line’. The poverty headcount (people living below the poverty line) is conducted by applying a log-normal distribution using per-capita income and a [[GINI coefficient]] to describe its distribution over a population. The poverty module addresses people living below the international poverty lines of USD 1.25 and USD 2 per day, at 2005 PPP, as defined by the World Bank ([[Ravallion et al., 2008]]).
== GISMO education model ==
The education model addresses future developments in school enrolment and educational attainment, including literacy rates, for three levels of education: primary, secondary and tertiary. The model tracks the shares of the highest completed education and the average years of schooling per cohort. The enrolment ratios per educational level are determined, using cross-sectional relationships with per-capita GDP (PPP). The ages at which children attain a certain educational level are assumed to be equal across all regions. Literacy rates are simulated by the share of the population aged 15+, who have completed at least their primary education. Furthermore, to take account of autonomous increases in literacy levels, those of the population between the ages of 15 and 65 are increase by 0.3%, annually.
}}
}}

Revision as of 08:54, 20 May 2014