Human development/Description: Difference between revisions
Jump to navigation
Jump to search
No edit summary |
No edit summary |
||
| Line 17: | Line 17: | ||
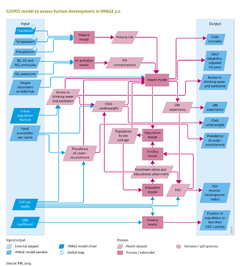
(ii) Access to food, water and energy. GISMO relates incidence and case fatality rates of major communicable (infectious) diseases to access to food, water and energy (see Table), with access defined by per-capita food availability, access to safe drinking water and improved sanitation, and access to modern energy sources for cooking and heating. The per-capita food availability (Kcal/cap/day) is obtained from the IMAGE model (Section 4.2). The levels of access to safe drinking water and improved sanitation are modelled separately by applying linear regression. The explanatory variables include GDP per capita, urbanisation rate and population density. Developments in water supply are assumed to be implemented ahead of sanitation. As such, developments in access follow a pathway from no sustainable access to safe drinking water and basic sanitation, to improved water supply only, improved water supply and sanitation, household connection for water supply only, and to a household connection for watersupply and sanitation. The level of access to modern energy sources for cooking and heating distinguishes between the use of 1) traditional biomass and coal on traditional stoves; 2) traditional biomass and coal on improved stoves; and 3) the use of modern energy carriers (electricity, natural gas, LPG, kerosene, modern biofuels and decentralised renewable sources). Trends in access to modern energy sources are taken from the TIMER residential model (Section 4.1.1). | (ii) Access to food, water and energy. GISMO relates incidence and case fatality rates of major communicable (infectious) diseases to access to food, water and energy (see Table), with access defined by per-capita food availability, access to safe drinking water and improved sanitation, and access to modern energy sources for cooking and heating. The per-capita food availability (Kcal/cap/day) is obtained from the IMAGE model (Section 4.2). The levels of access to safe drinking water and improved sanitation are modelled separately by applying linear regression. The explanatory variables include GDP per capita, urbanisation rate and population density. Developments in water supply are assumed to be implemented ahead of sanitation. As such, developments in access follow a pathway from no sustainable access to safe drinking water and basic sanitation, to improved water supply only, improved water supply and sanitation, household connection for water supply only, and to a household connection for watersupply and sanitation. The level of access to modern energy sources for cooking and heating distinguishes between the use of 1) traditional biomass and coal on traditional stoves; 2) traditional biomass and coal on improved stoves; and 3) the use of modern energy carriers (electricity, natural gas, LPG, kerosene, modern biofuels and decentralised renewable sources). Trends in access to modern energy sources are taken from the TIMER residential model (Section 4.1.1). | ||
{{FigureTemplate|Table_HD. | {{FigureTemplate|Table_HD.png}} | ||
Child underweight and prevalence of undernourishment. For children under the age of five, undernourishment is expressed as underweight (measured as weight-for-age), whereas for older ages prevalence of undernourishment is used. The direct effect of undernourishment is protein deficiency, which for children mortality rates is scaled to their underweight status; for older age groups, mortality rates are scaled to levels of undernourishment. Indirectly, undernourishment increases the incidence of diarrhoea and pneumonia, and the case fatality of malaria, diarrhoea and pneumonia. These indirect effects are only modelled for children under the age of five. | Child underweight and prevalence of undernourishment. For children under the age of five, undernourishment is expressed as underweight (measured as weight-for-age), whereas for older ages prevalence of undernourishment is used. The direct effect of undernourishment is protein deficiency, which for children mortality rates is scaled to their underweight status; for older age groups, mortality rates are scaled to levels of undernourishment. Indirectly, undernourishment increases the incidence of diarrhoea and pneumonia, and the case fatality of malaria, diarrhoea and pneumonia. These indirect effects are only modelled for children under the age of five. | ||
Revision as of 12:46, 9 December 2013
Parts of Human development/Description
| Component is implemented in: |
|
| Related IMAGE components |
| Projects/Applications |
| Models/Databases |
| Key publications |
| References |