IMAGE framework/IMAGE 3.0 in a nutshell: Difference between revisions
No edit summary |
Dafnomilii (talk | contribs) mNo edit summary |
||
| (24 intermediate revisions by 4 users not shown) | |||
| Line 1: | Line 1: | ||
{{FrameworkIntroductionPartTemplate | {{FrameworkIntroductionPartTemplate | ||
|PageLabel=IMAGE 3.0 in a nutshell | |||
|PageLabel= | |Sequence=2 | ||
|Sequence= | }} | ||
<div class="page_standard"> | |||
IMAGE 3.0 | <h2>The IMAGE 3.0 model</h2> | ||
IMAGE 3.0 is a comprehensive integrated modelling framework of interacting human and natural systems. The model framework is suited to large scale (primarily global) and long-term (up to the year 2100) assessments of interactions between human development and the natural environment. It integrates a range of sectors, ecosystems and indicators. The impacts of human activities on the natural systems and natural resources are assessed and how such impacts hamper the provision of ecosystem services to sustain human development. | |||
The model identifies socio-economic pathways, and projects the implications for energy, land, water and other natural resources, subject to resource availability and quality. Unintended side effects, such as emissions to air, water and soil, climatic change, and depletion and degradation of remaining stocks (fossil fuels, forests), are calculated and considered in future projections. | |||
===Features=== | |||
IMAGE has been designed to be comprehensive in terms of human activities, sectors and environmental impacts, and where and how these are connected through common drivers, mutual impacts, and synergies and trade-offs. IMAGE 3.0 is the latest version of the IMAGE framework models, and has the following features: | |||
* Comprehensive and balanced integration of energy and land | *Comprehensive and balanced integration of energy and land systems was a pioneering feature of IMAGE. Recently, other {{abbrTemplate|IAM}}s have been developed in similar directions and comprehensive IAMs are becoming more mainstream. | ||
*Coverage of all emissions by sources/sinks including natural sources/sinks makes IMAGE appropriate to provide input to bio-geochemistry models and complex Earth System Models ({{abbrTemplate|ESMs}}). | |||
*In addition to climate change, which is the primary focus of most IAMs, the IMAGE framework covers a broad range of closely interlinked dimensions. These include water availability and water quality, air quality, terrestrial and aquatic biodiversity, resource depletion, with competing claims on land and many ecosystem services. | |||
*Rather than averages over larger areas, spatial modelling of all terrestrial processes for specific grid cells captures the influence of local conditions and yields valuable results and insights for impact models. | |||
*IMAGE is based on biophysical/technical processes, capturing these processes' inherent constraints and limits. | |||
*Integrated into the IMAGE framework, [[MAGICC model|MAGICC-6]] is a simple climate model calibrated to more complex climate models. Using downscaling tools, this model uses the spatial patterns of temperature and precipitation changes, which vary between climate models. | |||
*Detailed descriptions of technical energy systems, and integration of land-use related emissions and carbon sinks enable IMAGE to explore very low greenhouse gas emissions scenarios, contributing to the increasingly explored field of very low climate forcing scenarios. | |||
*The integrated nature of IMAGE enables linkages between climate change, other environmental concerns and human development issues to be explored, thus contributing to informed discussion on a more sustainable future including trade-offs and synergies between stresses and possible solutions. | |||
===Model components=== | |||
{{DisplayFigureTemplate|IMAGE framework schematic}} | |||
The components of the IMAGE framework are presented in the [[IMAGE framework schematic]] (the figure on the right), which also shows the information flow from the critical driving factors to the impact indicators. An overview of the model components is provided in [[IMAGE_framework_summary]], and the model components are described in their component pages (via [[Framework overview|Components overview]]). | |||
Future pathways or scenarios depend on the assumed projections of key driving forces. Thus, all results can only be understood and interpreted in the context of the assumed future environment in which they unfold. | |||
[[ | As a result of the exogenous drivers, IMAGE projects how human activities would develop in the Human system, namely in the energy and agricultural systems (see [[IMAGE framework schematic]]). Human activities and the associated demand for ecosystem services are connected to the Earth System through the ‘interconnectors’ Land Cover and Land Use, and Emissions (see [[IMAGE framework schematic]]). | ||
Assumed policy interventions lead to model responses, taking into account all internal interactions and feedback. Impacts in various forms arise either directly from the model, for example, the extent of future land-use for agriculture and forestry or the average global temperature increase up to 2050. Other indicators are generated by activating additional models that use the output from the core IMAGE model and other assumptions to estimate the effects, such as biodiversity (GLOBIO; see Components [[Terrestrial biodiversity]] and [[Aquatic biodiversity]]) and [[flood risks]]. | |||
Currently, impacts emerging from additional models do not influence the outcome of the model run directly. The results obtained can reveal unsustainable or otherwise undesirable impacts and explore alternative model assumptions to alleviate the problem. As the alternative is implemented in the linked models, synergies and trade-offs against other indicators are revealed. | |||
====Base year==== | |||
As part of the model calibration, model settings are adjusted to reproduce the state-of-the-world over the period starting in 1970 to a final ‘base year’. This is done using exogenous data to calibrate internal parameters. From 2005 onwards, a range of model drivers rooted in more generic narratives and scenario drivers must be prepared either by experts or teams at PBL or partner institutes to provide inputs, such as population, economic projections and food production (see [[Drivers]]. These steps are taken in consultation with stakeholders and sponsors of the studies and with project partners. | |||
====IMAGE outputs==== | |||
An IMAGE run produces a long list of outputs representing the various parts of the framework, either as end indicator or as intermediate inputs driving operations further downstream. Together the outputs span the range from drivers to pressures, states and impacts. (See [[Variable overview]] and related overviews.) | |||
The IMAGE 3.0 model has a wide range of outputs, including: | |||
* energy use, conversion and supply; | |||
* agricultural production, land cover and land-use; | |||
* nutrient cycles in natural and agricultural systems; | |||
* emissions to air and surface water; | |||
* carbon stocks in biomass pools, soils, atmosphere and oceans; | |||
* atmospheric emissions of greenhouse gases and air pollutants; | |||
* concentration of greenhouse gases in the atmosphere and radiative forcing; | |||
* changes in temperature and precipitation; | |||
* sea-level rise; | |||
* water use for irrigation. | |||
These standard outputs are complemented with additional impact models with indicators for biodiversity, human development, water stress, and flood risks. | |||
===Spatial resolution=== | |||
{{DisplayFigureTemplate|Region classification map}} | |||
While IMAGE is designed to address global issues, impacts and challenges tend to occur at different geographic scales and different degrees in different parts of the world. This depends on location-specific biophysical conditions and the level of human development (for example, high income, industrialized versus low income, subsistence agriculture dominated regions and all levels in between). It implies that indicators at the level of global totals or global averages are rarely adequate to reveal the real problems. Furthermore, policy interventions and governance structures are not uniform across scales, administrative entities, and areas defined by cultural and political factors. | |||
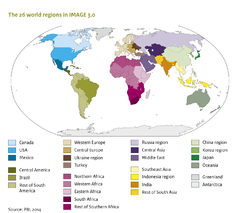
IMAGE models socio-economic developments in 26 world regions to capture spatial and multi-scale differences (see the figure). Land use, land cover, and associated biophysical processes are treated at the grid level to capture local dynamics. The grid size has been reduced to 5 x 5 arcminutes in IMAGE 3.0 (corresponding to 10 x 10 km at the equator), from 30 x 30 arcminutes (0.5 x 0.5 degrees) in IMAGE 2. Operating within global boundaries, the regional approach provides insight to identify where specific problems manifest, where the driving factors are concentrated, and how changes in some regions influence other regions. | |||
===Areas of application=== | |||
An integrated framework, such as IMAGE 3.0, covers a wide range of human and Earth systems components and contains variables in many domains. Development and applications of the IMAGE framework focus on two interrelated clusters: energy and climate; and food, land, water and biodiversity. | |||
There are many relationships between these two clusters in IMAGE. For instance, climate change impacts agriculture and nature, land use for bioenergy has implications for food prices, and water for irrigation competes with water for coolant in electric power plants. Synergies and trade-offs are interesting from the perspective of policy discussions concerning the complicating effects of unintended and often undesirable impacts. IMAGE 3.0 can generate a long and widely diverging set of indicators for different sectors and regions. | |||
===Modular structure=== | |||
{{DisplayFigureTemplate|IMAGE framework schematic}} | |||
Over the years, various components of the IMAGE framework have been replaced by expert models developed outside IMAGE, which be used either as stand-alone models or within the IMAGE framework (see [[Computer models overview]]) . | |||
The IMAGE 3.0 core model comprises most processes in the Human system, the Earth system and their connectors Land cover/Land use and Emissions, and parts of the impacts (see the figure on the right). This core model consists of IMAGE/TIMER energy and IMAGE/Land & Climate. The latter also includes the LPJmL model, an essential component of any IMAGE model run, representing carbon, water, crop and vegetation dynamics. | |||
The IMAGE 3.0 framework contains other models used to simulate impacts (such as, [[GLOBIO model|GLOBIO]], [[GLOFRIS model|GLOFRIS]] and [[GISMO model|GISMO]]) and models that describe parts of the Human system, such as agro-economic models ([[MAGNET model|MAGNET]] and [[IMPACT model|IMPACT]]) to project future agricultural production requirements. Furthermore, policy models, such as [[FAIR model|FAIR]], are used to explore the effectiveness, efficiency, and equity of climate policy regimes and provide input on emission constraints and price signals arising from climate policy proposals. | |||
</div> | |||
Latest revision as of 16:58, 7 October 2021
| Projects/Applications |
| Models/Databases |
| Relevant overviews |
The IMAGE 3.0 model
IMAGE 3.0 is a comprehensive integrated modelling framework of interacting human and natural systems. The model framework is suited to large scale (primarily global) and long-term (up to the year 2100) assessments of interactions between human development and the natural environment. It integrates a range of sectors, ecosystems and indicators. The impacts of human activities on the natural systems and natural resources are assessed and how such impacts hamper the provision of ecosystem services to sustain human development.
The model identifies socio-economic pathways, and projects the implications for energy, land, water and other natural resources, subject to resource availability and quality. Unintended side effects, such as emissions to air, water and soil, climatic change, and depletion and degradation of remaining stocks (fossil fuels, forests), are calculated and considered in future projections.
Features
IMAGE has been designed to be comprehensive in terms of human activities, sectors and environmental impacts, and where and how these are connected through common drivers, mutual impacts, and synergies and trade-offs. IMAGE 3.0 is the latest version of the IMAGE framework models, and has the following features:
- Comprehensive and balanced integration of energy and land systems was a pioneering feature of IMAGE. Recently, other IAMs have been developed in similar directions and comprehensive IAMs are becoming more mainstream.
- Coverage of all emissions by sources/sinks including natural sources/sinks makes IMAGE appropriate to provide input to bio-geochemistry models and complex Earth System Models (ESMs).
- In addition to climate change, which is the primary focus of most IAMs, the IMAGE framework covers a broad range of closely interlinked dimensions. These include water availability and water quality, air quality, terrestrial and aquatic biodiversity, resource depletion, with competing claims on land and many ecosystem services.
- Rather than averages over larger areas, spatial modelling of all terrestrial processes for specific grid cells captures the influence of local conditions and yields valuable results and insights for impact models.
- IMAGE is based on biophysical/technical processes, capturing these processes' inherent constraints and limits.
- Integrated into the IMAGE framework, MAGICC-6 is a simple climate model calibrated to more complex climate models. Using downscaling tools, this model uses the spatial patterns of temperature and precipitation changes, which vary between climate models.
- Detailed descriptions of technical energy systems, and integration of land-use related emissions and carbon sinks enable IMAGE to explore very low greenhouse gas emissions scenarios, contributing to the increasingly explored field of very low climate forcing scenarios.
- The integrated nature of IMAGE enables linkages between climate change, other environmental concerns and human development issues to be explored, thus contributing to informed discussion on a more sustainable future including trade-offs and synergies between stresses and possible solutions.
Model components
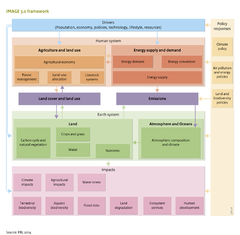
The components of the IMAGE framework are presented in the IMAGE framework schematic (the figure on the right), which also shows the information flow from the critical driving factors to the impact indicators. An overview of the model components is provided in IMAGE_framework_summary, and the model components are described in their component pages (via Components overview).
Future pathways or scenarios depend on the assumed projections of key driving forces. Thus, all results can only be understood and interpreted in the context of the assumed future environment in which they unfold.
As a result of the exogenous drivers, IMAGE projects how human activities would develop in the Human system, namely in the energy and agricultural systems (see IMAGE framework schematic). Human activities and the associated demand for ecosystem services are connected to the Earth System through the ‘interconnectors’ Land Cover and Land Use, and Emissions (see IMAGE framework schematic).
Assumed policy interventions lead to model responses, taking into account all internal interactions and feedback. Impacts in various forms arise either directly from the model, for example, the extent of future land-use for agriculture and forestry or the average global temperature increase up to 2050. Other indicators are generated by activating additional models that use the output from the core IMAGE model and other assumptions to estimate the effects, such as biodiversity (GLOBIO; see Components Terrestrial biodiversity and Aquatic biodiversity) and flood risks.
Currently, impacts emerging from additional models do not influence the outcome of the model run directly. The results obtained can reveal unsustainable or otherwise undesirable impacts and explore alternative model assumptions to alleviate the problem. As the alternative is implemented in the linked models, synergies and trade-offs against other indicators are revealed.
Base year
As part of the model calibration, model settings are adjusted to reproduce the state-of-the-world over the period starting in 1970 to a final ‘base year’. This is done using exogenous data to calibrate internal parameters. From 2005 onwards, a range of model drivers rooted in more generic narratives and scenario drivers must be prepared either by experts or teams at PBL or partner institutes to provide inputs, such as population, economic projections and food production (see Drivers. These steps are taken in consultation with stakeholders and sponsors of the studies and with project partners.
IMAGE outputs
An IMAGE run produces a long list of outputs representing the various parts of the framework, either as end indicator or as intermediate inputs driving operations further downstream. Together the outputs span the range from drivers to pressures, states and impacts. (See Variable overview and related overviews.)
The IMAGE 3.0 model has a wide range of outputs, including:
- energy use, conversion and supply;
- agricultural production, land cover and land-use;
- nutrient cycles in natural and agricultural systems;
- emissions to air and surface water;
- carbon stocks in biomass pools, soils, atmosphere and oceans;
- atmospheric emissions of greenhouse gases and air pollutants;
- concentration of greenhouse gases in the atmosphere and radiative forcing;
- changes in temperature and precipitation;
- sea-level rise;
- water use for irrigation.
These standard outputs are complemented with additional impact models with indicators for biodiversity, human development, water stress, and flood risks.
Spatial resolution
While IMAGE is designed to address global issues, impacts and challenges tend to occur at different geographic scales and different degrees in different parts of the world. This depends on location-specific biophysical conditions and the level of human development (for example, high income, industrialized versus low income, subsistence agriculture dominated regions and all levels in between). It implies that indicators at the level of global totals or global averages are rarely adequate to reveal the real problems. Furthermore, policy interventions and governance structures are not uniform across scales, administrative entities, and areas defined by cultural and political factors.
IMAGE models socio-economic developments in 26 world regions to capture spatial and multi-scale differences (see the figure). Land use, land cover, and associated biophysical processes are treated at the grid level to capture local dynamics. The grid size has been reduced to 5 x 5 arcminutes in IMAGE 3.0 (corresponding to 10 x 10 km at the equator), from 30 x 30 arcminutes (0.5 x 0.5 degrees) in IMAGE 2. Operating within global boundaries, the regional approach provides insight to identify where specific problems manifest, where the driving factors are concentrated, and how changes in some regions influence other regions.
Areas of application
An integrated framework, such as IMAGE 3.0, covers a wide range of human and Earth systems components and contains variables in many domains. Development and applications of the IMAGE framework focus on two interrelated clusters: energy and climate; and food, land, water and biodiversity.
There are many relationships between these two clusters in IMAGE. For instance, climate change impacts agriculture and nature, land use for bioenergy has implications for food prices, and water for irrigation competes with water for coolant in electric power plants. Synergies and trade-offs are interesting from the perspective of policy discussions concerning the complicating effects of unintended and often undesirable impacts. IMAGE 3.0 can generate a long and widely diverging set of indicators for different sectors and regions.
Modular structure
Over the years, various components of the IMAGE framework have been replaced by expert models developed outside IMAGE, which be used either as stand-alone models or within the IMAGE framework (see Computer models overview) .
The IMAGE 3.0 core model comprises most processes in the Human system, the Earth system and their connectors Land cover/Land use and Emissions, and parts of the impacts (see the figure on the right). This core model consists of IMAGE/TIMER energy and IMAGE/Land & Climate. The latter also includes the LPJmL model, an essential component of any IMAGE model run, representing carbon, water, crop and vegetation dynamics.
The IMAGE 3.0 framework contains other models used to simulate impacts (such as, GLOBIO, GLOFRIS and GISMO) and models that describe parts of the Human system, such as agro-economic models (MAGNET and IMPACT) to project future agricultural production requirements. Furthermore, policy models, such as FAIR, are used to explore the effectiveness, efficiency, and equity of climate policy regimes and provide input on emission constraints and price signals arising from climate policy proposals.