IMAGE framework summary/Impacts: Difference between revisions
No edit summary |
Dafnomilii (talk | contribs) mNo edit summary |
||
| (21 intermediate revisions by 2 users not shown) | |||
| Line 1: | Line 1: | ||
{{FrameworkSummaryPartTemplate | {{FrameworkSummaryPartTemplate | ||
|PageLabel= | |PageLabel=Impacts | ||
|Sequence= | |Sequence=7 | ||
}} | |||
<div class="page_standard"> | |||
<h2>Impacts of environmental change</h2> | |||
Several impacts of global environmental change are calculated in IMAGE (Component [[Impacts]]). Here we describe biodiversity loss and impacts on human development. | |||
===Biodiversity loss === | |||
Biodiversity loss is assessed by the impact model GLOBIO (Component [[Terrestrial biodiversity]]) as calculated changes in mean species abundance ({{abbrTemplate|MSA}}). The MSA indicator maps the effect of direct and indirect drivers of biodiversity loss provided by IMAGE, including climate, land-use change, ecosystem fragmentation, expansion of infrastructure, disturbance of habitats, and acid and reactive nitrogen deposition. Their compound effect on biodiversity is computed with the [[GLOBIO model|GLOBIO3 model]] for terrestrial ecosystems. As IMAGE and GLOBIO3 models are spatially explicit, the impacts on MSA can be analysed on a grid by region, main biome and pressure factor. A similar model has been developed to map biodiversity in fresh water (Component [[Aquatic biodiversity]]). | |||
<BlockQuote> | <BlockQuote> | ||
Example: | Example: A further decline in biodiversity is projected in the Rio+20 baseline at an almost historical rate. While historically habitat loss has been the key driver of biodiversity loss, more important pressures in the coming decades are projected to be climate change, forestry and infrastructure (the figure below). | ||
</BlockQuote> | </BlockQuote> | ||
{{DisplayFigureLeftOptimalTemplate| | {{DisplayFigureLeftOptimalTemplate|Policy intervention figure Land and biodiversity policies II}} | ||
=== | ===Human development=== | ||
Changes in the global environmental impact on human development in many ways. Via the link to the [[GISMO model]], the IMAGE framework describes impacts on human health, and the achievement of human development goals such as the Millennium Development Goals (MDGs; see Component [[Human development]]). The health module describes the burden of disease per gender and age, including communicable diseases, and also health impacts of air pollution and undernourishment, and interactions between these factors. | |||
<BlockQuote> | The model puts the impacts of global environmental change in perspective of other factors determining human health. For instance, hunger is defined as the proportion of the population with food consumption below the minimum dietary energy requirement. The model determined hunger on the basis of distribution of food intake over individuals calculated on the mean food availability per capita (from other parts of IMAGE), and a coefficient of variation. | ||
Example: | Water supply levels and sanitation are modelled separately for urban and rural populations by applying an empirical regression model, depending on per capita GDP, urbanisation rate and population density. | ||
</BlockQuote> | <BlockQuote> | ||
{{DisplayFigureLeftOptimalTemplate| | Example: With regard to global hunger, the Rio+20 scenario shows improvement compared to the last few decades. This improvement is a consequence of rapid income growth in low-income regions and levelling off of population growth (the figure below). The baseline scenario also shows a decline in population without access to safe drinking water, sanitation and modern energy. In all cases, the improvement is too slow compared to policy ambitions. | ||
[[ | </BlockQuote> | ||
{{DisplayFigureLeftOptimalTemplate|Figure6 IMAGE framework summary}} | |||
===Other impacts=== | |||
Other impacts calculated in the IMAGE framework using separate impact models include flood risks (Component [[Flood risks]]), land degradation (Component [[Land degradation]]) and ecosystem services (Component [[Ecosystem services]]). Many impacts of global environmental change are an integral part of the modules in the Human system and the Earth system, such as water stress and climate change impact on crop yields (Component [[Impacts]]). | |||
</div> | |||
Latest revision as of 15:48, 21 October 2021
| Projects/Applications |
| Relevant overviews |
| Key publications |
Impacts of environmental change
Several impacts of global environmental change are calculated in IMAGE (Component Impacts). Here we describe biodiversity loss and impacts on human development.
Biodiversity loss
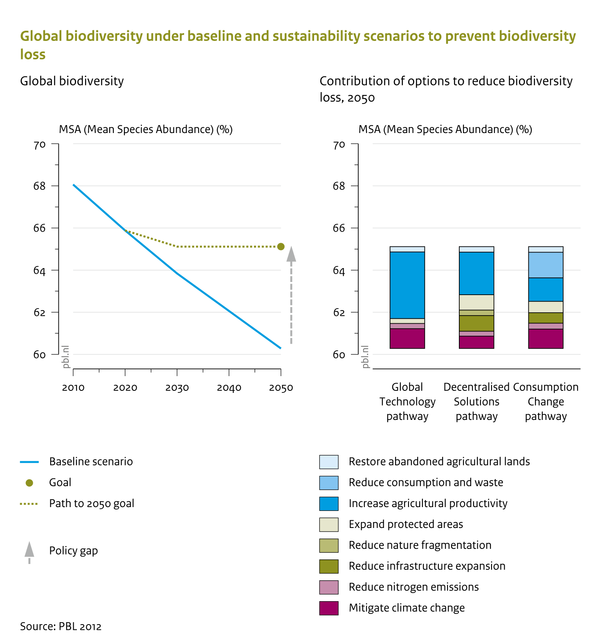
Biodiversity loss is assessed by the impact model GLOBIO (Component Terrestrial biodiversity) as calculated changes in mean species abundance (MSA). The MSA indicator maps the effect of direct and indirect drivers of biodiversity loss provided by IMAGE, including climate, land-use change, ecosystem fragmentation, expansion of infrastructure, disturbance of habitats, and acid and reactive nitrogen deposition. Their compound effect on biodiversity is computed with the GLOBIO3 model for terrestrial ecosystems. As IMAGE and GLOBIO3 models are spatially explicit, the impacts on MSA can be analysed on a grid by region, main biome and pressure factor. A similar model has been developed to map biodiversity in fresh water (Component Aquatic biodiversity).
Example: A further decline in biodiversity is projected in the Rio+20 baseline at an almost historical rate. While historically habitat loss has been the key driver of biodiversity loss, more important pressures in the coming decades are projected to be climate change, forestry and infrastructure (the figure below).
Human development
Changes in the global environmental impact on human development in many ways. Via the link to the GISMO model, the IMAGE framework describes impacts on human health, and the achievement of human development goals such as the Millennium Development Goals (MDGs; see Component Human development). The health module describes the burden of disease per gender and age, including communicable diseases, and also health impacts of air pollution and undernourishment, and interactions between these factors.
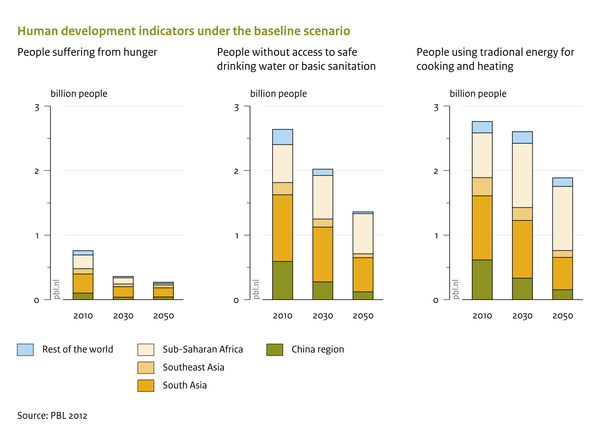
The model puts the impacts of global environmental change in perspective of other factors determining human health. For instance, hunger is defined as the proportion of the population with food consumption below the minimum dietary energy requirement. The model determined hunger on the basis of distribution of food intake over individuals calculated on the mean food availability per capita (from other parts of IMAGE), and a coefficient of variation. Water supply levels and sanitation are modelled separately for urban and rural populations by applying an empirical regression model, depending on per capita GDP, urbanisation rate and population density.
Example: With regard to global hunger, the Rio+20 scenario shows improvement compared to the last few decades. This improvement is a consequence of rapid income growth in low-income regions and levelling off of population growth (the figure below). The baseline scenario also shows a decline in population without access to safe drinking water, sanitation and modern energy. In all cases, the improvement is too slow compared to policy ambitions.
Other impacts
Other impacts calculated in the IMAGE framework using separate impact models include flood risks (Component Flood risks), land degradation (Component Land degradation) and ecosystem services (Component Ecosystem services). Many impacts of global environmental change are an integral part of the modules in the Human system and the Earth system, such as water stress and climate change impact on crop yields (Component Impacts).