Nutrients: Difference between revisions
Jump to navigation
Jump to search
Oostenrijr (talk | contribs) No edit summary |
No edit summary |
||
| (5 intermediate revisions by the same user not shown) | |||
| Line 2: | Line 2: | ||
|Application=Roads from Rio+20 (2012) project; Shared Socioeconomic Pathways - SSP (2014) project; The Protein Puzzle (2011) project; | |Application=Roads from Rio+20 (2012) project; Shared Socioeconomic Pathways - SSP (2014) project; The Protein Puzzle (2011) project; | ||
|IMAGEComponent=Drivers; Agricultural economy; Land-use allocation; Agriculture and land use; Aquatic biodiversity; Emissions; Land cover and land use; Livestock systems; | |IMAGEComponent=Drivers; Agricultural economy; Land-use allocation; Agriculture and land use; Aquatic biodiversity; Emissions; Land cover and land use; Livestock systems; | ||
|KeyReference=Beusen, 2014; | |KeyReference=Beusen, 2014; Beusen et al., 2015; Beusen et al., 2016; Morée et al., 2013; | ||
|Reference=Bouwman et al., 2013c; Galloway et al., 2004; Zhang et al., 2010; Diaz and Rosenberg, 2008; UNEP, 2002; Rabalais, 2002; | |Reference=Bouwman et al., 2013c; Galloway et al., 2004; Zhang et al., 2010; Diaz and Rosenberg, 2008; UNEP, 2002; Rabalais, 2002; Beusen et al., 2015; Beusen et al., 2016 | ||
|InputVar=Population - grid; GDP per capita - grid; Land cover, land use - grid; Animal stocks; Livestock rations; Manure spreading fraction; Nitrogen deposition - grid; Actual crop and grass production - grid; Production system mix; Fertiliser use efficiency; | |InputVar=Population - grid; GDP per capita - grid; Land cover, land use - grid; Animal stocks; Livestock rations; Manure spreading fraction; Nitrogen deposition - grid; Actual crop and grass production - grid; Production system mix; Fertiliser use efficiency; | ||
|OutputVar=NH3 emissions - grid; N and P discharge to surface water - grid; Soil N budget - grid; Soil P budget - grid; N and P in wastewater discharge - grid; | |OutputVar=NH3 emissions - grid; N and P discharge to surface water - grid; Soil N budget - grid; Soil P budget - grid; N and P in wastewater discharge - grid; | ||
| Line 12: | Line 12: | ||
This has resulted in negative impacts on human health and the environment, such as groundwater pollution, loss of habitat and biodiversity, an increases in the frequency and severity of harmful algal blooms, eutrophication, hypoxia and fish kills ([[Diaz and Rosenberg, 2008]]; [[Zhang et al., 2010]]). The harmful effects of eutrophication have spread rapidly around the world, with large-scale implications for biodiversity, water quality, fisheries and recreation, in both industrialised and developing regions ([[UNEP, 2002]]). Input of nutrients in freshwater and coastal marine ecosystems, also disturbs the stoichiometric balance of N, P and Si (silicon) ([[Rabalais, 2002]]) affecting total plant production and the species composition in ecosystems. | This has resulted in negative impacts on human health and the environment, such as groundwater pollution, loss of habitat and biodiversity, an increases in the frequency and severity of harmful algal blooms, eutrophication, hypoxia and fish kills ([[Diaz and Rosenberg, 2008]]; [[Zhang et al., 2010]]). The harmful effects of eutrophication have spread rapidly around the world, with large-scale implications for biodiversity, water quality, fisheries and recreation, in both industrialised and developing regions ([[UNEP, 2002]]). Input of nutrients in freshwater and coastal marine ecosystems, also disturbs the stoichiometric balance of N, P and Si (silicon) ([[Rabalais, 2002]]) affecting total plant production and the species composition in ecosystems. | ||
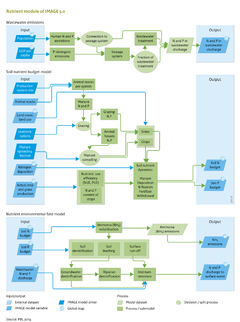
To assess eutrophication as a consequence of increasing population, and economic and technological development, IMAGE 3.0 includes a nutrient model ([[Beusen, 2014]]), which comprises three sub-models: | To assess eutrophication as a consequence of increasing population, and economic and technological development, IMAGE 3.0 includes a nutrient model ([[Beusen, 2014]]; [[Beusen et al., 2015]]; [[Beusen et al., 2016]]), which comprises three sub-models: | ||
# Wastewater module calculating nutrient flows in wastewater discharges (Figure Flowchart, top); | # Wastewater module calculating nutrient flows in wastewater discharges (Figure Flowchart, top); | ||
# Soil nutrient budget module describing all input and output of N and P in soil compartments (Figure Flowchart, middle); | # Soil nutrient budget module describing all input and output of N and P in soil compartments (Figure Flowchart, middle); | ||
Revision as of 14:36, 2 November 2016
| Component is implemented in: |
| Components: |
| Related IMAGE components |
| Projects/Applications |
| Key publications |
| References |
Key policy issues
- How will the increasing use of fertilisers affect terrestrial and marine ecosystems, with possible consequences for human health?
- To what extent can the negative impacts be reduced by more efficient nutrient management and wastewater treatment, while retaining the positive effects on food production and land productivity?