Nutrients/Description: Difference between revisions
Jump to navigation
Jump to search
No edit summary |
Oostenrijr (talk | contribs) m (Text replacement - "et al. 2" to "et al., 2") |
||
| (4 intermediate revisions by one other user not shown) | |||
| Line 1: | Line 1: | ||
{{ComponentDescriptionTemplate | {{ComponentDescriptionTemplate | ||
|Reference=Bouwman et al., 2013c; Van Drecht et al., 2009; Cleveland et al., 1999; Salvagiotti et al., 2008; Beusen et al., 2014; Beusen et al., 2015; Beusen et al., 2016; | |Reference=Bouwman et al., 2013c; Van Drecht et al., 2009; Cleveland et al., 1999; Salvagiotti et al., 2008; Beusen et al., 2014; Beusen et al., 2015; Beusen et al., 2016; | ||
|Description====Wastewater=== | |Description====General=== | ||
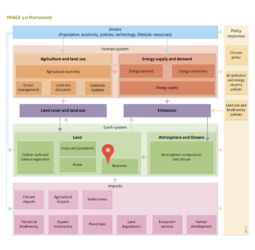
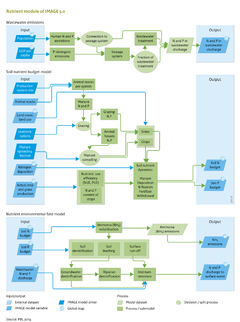
The IMAGE-Global Nutrient Model (GNM) is a global distributed spatially explicit model using hydrology as the basis for describing nitrogen (N) and phosphorus (P) delivery to surface water and transport and in-stream retention in rivers, lakes, wetlands and reservoirs. IMAGE-GNM is coupled to the PCR-GLOBWB global hydrological model ([[Van Beek et al., 2011]]). In the IMAGE-GNM model, grid cells receive water with dissolved and suspended N and P from upstream grid cells; inside grid cells, N and P are delivered to water bodies via diffuse sources (surface runoff, shallow and deep groundwater, riparian zones; litterfall in floodplains; atmospheric deposition) and point sources (wastewater); N and P retention in a water body is calculated on the basis of the residence time of the water and nutrient uptake velocity; subsequently, water and nutrients are transported to downstream grid cells. | |||
===Wastewater=== | |||
Urban wastewater contains N and P emitted by households and industries that are connected to a sewerage system, and households with sanitation but without a sewerage connection. | Urban wastewater contains N and P emitted by households and industries that are connected to a sewerage system, and households with sanitation but without a sewerage connection. | ||
| Line 52: | Line 55: | ||
# the approach includes the effect of pH on denitrification. | # the approach includes the effect of pH on denitrification. | ||
==== | ====Nutrients from vegetation in floodplains==== | ||
NPP from the LPJ model [[Carbon cycle and natural vegetation]] for wetlands and floodplains are used. Part of annual NPP is assumed to be deposited in the water during flooding, and where flooding is temporary, the litter from preceeding periods is assumed to be available for transport in the flood water. 50% of total NPP is assumed to end in the surface water. | NPP from the LPJ model [[Carbon cycle and natural vegetation]] for wetlands and floodplains are used. Part of annual NPP is assumed to be deposited in the water during flooding, and where flooding is temporary, the litter from preceeding periods is assumed to be available for transport in the flood water. 50% of total NPP is assumed to end in the surface water. | ||
====Other sources==== | ====Other direct sources of nutrients==== | ||
Other sources include aquaculture, weathering and atmospheric deposition. Deposition is from the same data as used for the land nutriënt budgets. Aquaculture is taken from data from two recent studies, and weathering. The calculation of P release from weathering is based on a recent study ([[Hartmann et al., 2014]]) which uses the lithological classes distinguished by ([[Dürr et al., 2005]]). The lithological classes are available on a 5 by 5 minute resolution, hence the weighted average P concentration within each 0.5 by 0.5 degree grid cell is calculated. | Other sources include aquaculture, weathering and atmospheric deposition. Deposition is from the same data as used for the land nutriënt budgets. Aquaculture is taken from data from two recent studies ([[Bouwman et al., 2011]]; [[Bouwman et al., 2013c]]), and weathering. The calculation of P release from weathering is based on a recent study ([[Hartmann et al., 2014]]) which uses the lithological classes distinguished by ([[Dürr et al., 2005]]). The lithological classes are available on a 5 by 5 minute resolution, hence the weighted average P concentration within each 0.5 by 0.5 degree grid cell is calculated. | ||
====In-stream nutrient retention==== | ====In-stream nutrient retention==== | ||
The water that enters streams and rivers through surface runoff and discharges from groundwater and riparian zones is routed through stream and river channels, and passes through lakes, wetlands and reservoirs. The nutrient retention in each of these systems is calculated on the basis of the nutrient spiralling ecological concept, which is based on residence time and temperature as described in ([[Beusen et al., 2014]]; [[Beusen et al., 2015]]). | The water that enters streams and rivers through surface runoff and discharges from groundwater and riparian zones is routed through stream and river channels, and passes through lakes, wetlands and reservoirs. The history of the construction of reservoirs during the 20th century is based on data from ([[Lehner et al., 2011]]). The nutrient retention in each of these systems is calculated on the basis of the nutrient spiralling ecological concept, which is based on residence time and temperature as described in ([[Beusen et al., 2014]]; [[Beusen et al., 2015]]). | ||
}} | }} | ||
Revision as of 14:44, 20 June 2017
Parts of Nutrients/Description
| Component is implemented in: |
| Components: |
| Related IMAGE components |
| Projects/Applications |
| Key publications |
| References |