Nutrients/Policy issues: Difference between revisions
Jump to navigation
Jump to search
No edit summary |
No edit summary |
||
| Line 2: | Line 2: | ||
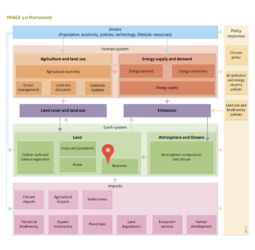
|Description=Under baseline scenarios of IMAGE-GNM, N surpluses generally increase. For example, in the Rio+20 baseline scenario, the N surplus increases by 35% globally in the period 2002-2050 (the figure below). This is the result of decreasing trends in North America, Western Europe and Japan as a result of increasing nutrient use efficiency, and stabilisation in India. In all other regions, N surpluses increase, particularly in Sub-Saharan Africa and Southeastern Asia as a result of increasing fertilizer use to halt soil nutrient depletion (the figure below). The situation is similar for P, with large increases in developing countries. | |Description=Under baseline scenarios of IMAGE-GNM, N surpluses generally increase. For example, in the Rio+20 baseline scenario, the N surplus increases by 35% globally in the period 2002-2050 (the figure below). This is the result of decreasing trends in North America, Western Europe and Japan as a result of increasing nutrient use efficiency, and stabilisation in India. In all other regions, N surpluses increase, particularly in Sub-Saharan Africa and Southeastern Asia as a result of increasing fertilizer use to halt soil nutrient depletion (the figure below). The situation is similar for P, with large increases in developing countries. | ||
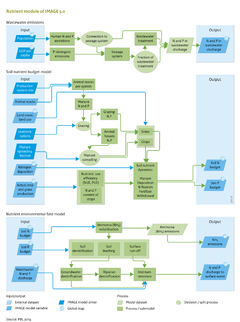
No scenarios have been implemented yet with the full IMAGE-GNM. However, results for the 20th century show that the global river N export (19 to 37 Tg/yr, or +90%) increased faster than P export (2 to 4 Tg/yr or +75%). The increase in export by rivers draining into the Pacific Ocean (3.7 to 14.7 Tg N/yr, increase by a factor of 4; 0.6 to 1.6 Tg P per year, factor of 1.5) and Mediterranean Sea and Black Sea (0.9 to 2.1 Tg N/yr, +126%; 0.2 to 0.4 Tg P yr-1, +80% ) was much faster than in other parts of the world (the figure below). The increase in P export was smaller than that of N in world regions. The differential increase of N and P explains the increase in the N:P ratio in rivers draining into the Pacific Ocean (13 to 20), Indian Ocean (14 to 18 since 1970), Mediterranean Sea and Black Sea (10 to 13). There was no clear increase in the regions draining into the Atlantic Ocean. | |||
{{ | |||
{{DisplayFigurelTemplate|<Figure baseline_nutrients>}} | |||
|Example=Economic developments and policy interventions may modify individual terms in the soil nutrient budget (Formula 1, [[Nutrients/Description|Model description part]]), and the fate of nutrients in the environment. For example, agricultural demand (Component [[Agricultural economy]]) affects: | |Example=Economic developments and policy interventions may modify individual terms in the soil nutrient budget (Formula 1, [[Nutrients/Description|Model description part]]), and the fate of nutrients in the environment. For example, agricultural demand (Component [[Agricultural economy]]) affects: | ||
* production of leguminous crops (pulses and soybeans) and biological N fixation as a consequence; | * production of leguminous crops (pulses and soybeans) and biological N fixation as a consequence; | ||
Revision as of 10:44, 3 November 2016
Parts of Nutrients/Policy issues
| Component is implemented in: |
| Components: |
| Related IMAGE components |
| Projects/Applications |
| Key publications |