File:Article Figure 1 Global and regional cost-supply curves and their geographic locations.png
Original file (1,386 × 2,015 pixels, file size: 371 KB, MIME type: image/png)
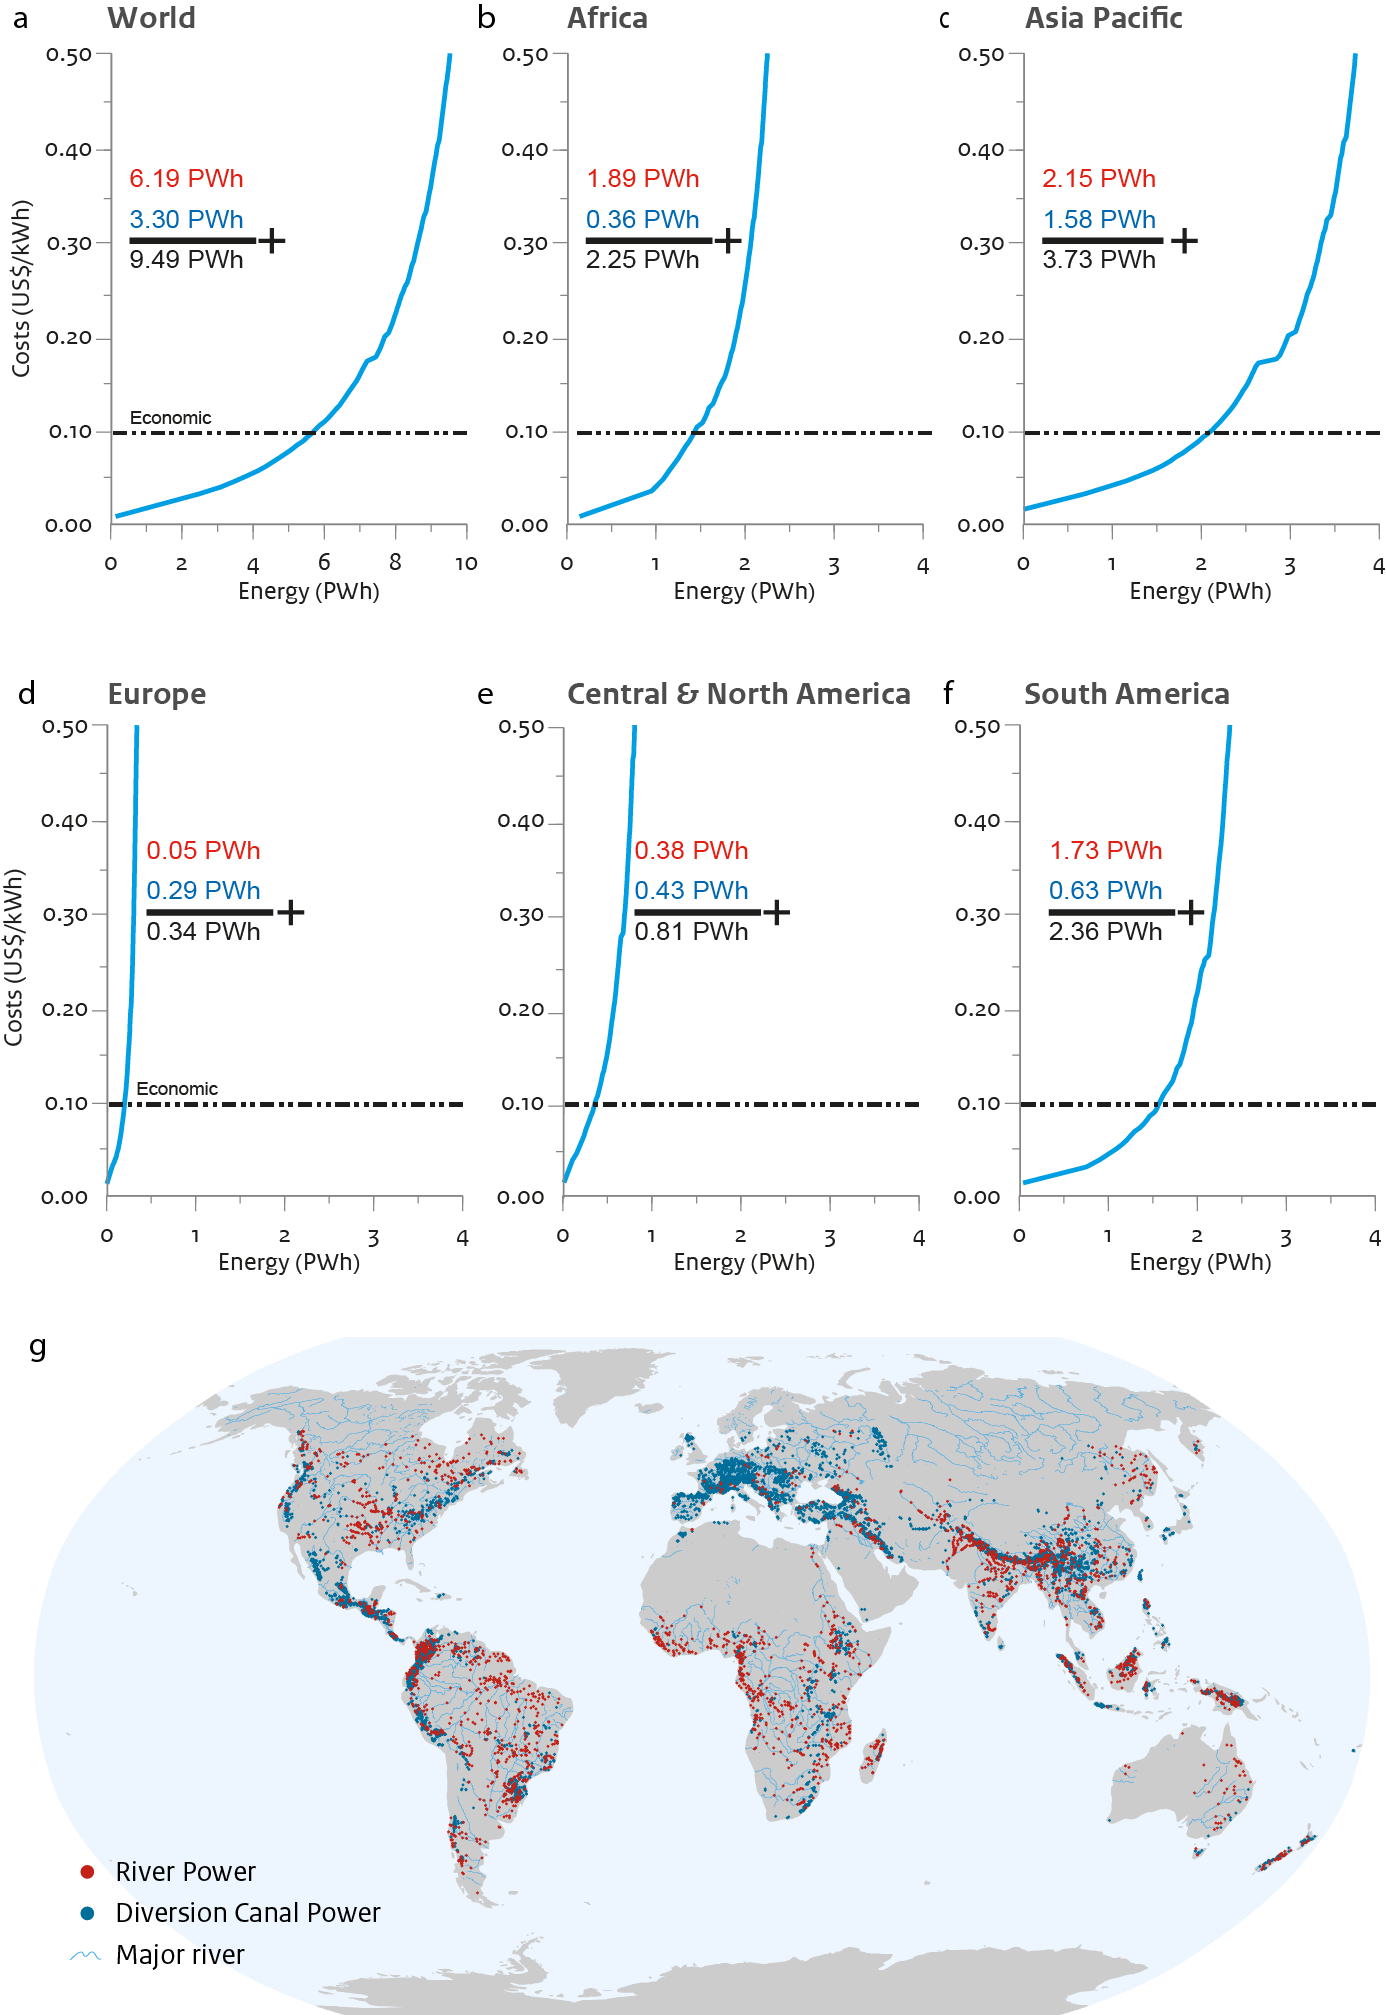
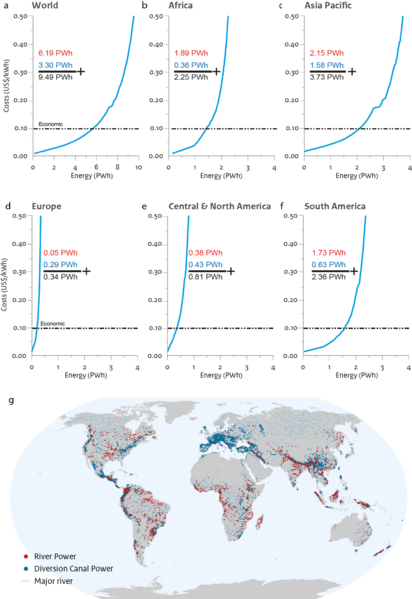
Global and regional cost-supply curves and their geographic locations. a-f, The global (a) and regional (Africa (b), Asia Pacific (c), Europe (d), Central and North America (e) and South America (f)) cost-supply curves showing the remaining technical potential below 0.50 $ kWh-1. The red numbers indicate the total river power potential, the blue numbers the total diversion canal power potential and the black numbers the sum of both. The dot-dashed line indicates the remaining economic potential below a cost of 0.10 $ kWh-1. g, The geographic locations of the two hydropower systems.
File history
Click on a date/time to view the file as it appeared at that time.
| Date/Time | Thumbnail | Dimensions | User | Comment | |
|---|---|---|---|---|---|
| current | 16:02, 25 April 2019 | | 1,386 × 2,015 (371 KB) | Gernaatd (talk | contribs) |
You cannot overwrite this file.
File usage
There are no pages that use this file.