USS manual
The User Support System (USS) is connected to this website, i.e. the IMAGE framework website. When exploring the graphs in USS, click on a graph or box and press F1. A browser windows pops up showing the related documentation page on this site, usually about the model component that outputs the indicator. This 'How to ...' page is directly accessible via the home button in the USS-browser.
How to handle boxes
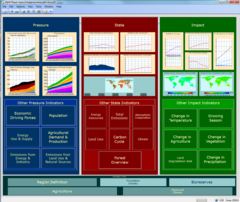
The USS is designed as a hierarchical system of boxes. A box may contain other boxes or an indicator. The four main boxes are all boxes containing boxes.
A box may be opened by double clicking or selecting 'open' from the right click menu. Alternatively, 'open level' from the right-click menu will open the box and its graphs.
When holding the "Shift' key while double clicking, USS opens and zooms in on a closed box/graph or closes and zooms out on an open box/graph. Labels are not always visible on graphs in a box. Zooming in on a graph solves this.
Note that the right click menu items are context depending. Right click on the graph itself results in other options then right click on the border of the graph.
About indicators:
- An indicator may be represented in a graph, chart or in a map.
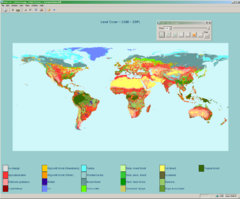
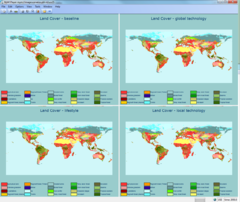
- A cream-colored box contains a graph or chart, a blue box contains a map.
How to explore graphs
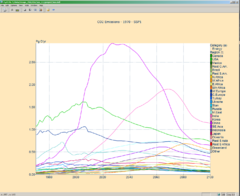
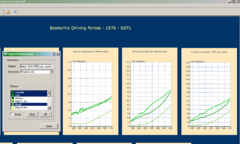
A graph is composed of a graph area and a border area. The right border shows the dimensions and its items of this particular indicator. The left border shows the unit and its range. The lower border shows the time axis. From the edit menu or the top menu icons several dialogs can be opened to manipulate graphs.
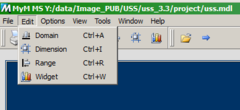
The 'Edit' menu contains the following options (also available as icon):
- Domain: to scale the X-axis.
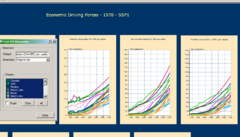
- Dimension: to make a cross-section of classes of the available dimensions.
- Range: to scale the Y-axis
- Widget: to define the graph type.
Note on dimensions: Corresponding dimensions are coupled for all graphs in the USS with the same identifier. Selecting a set in the dimension dialog will affect all corresponding graphs. After modifying the dimensions of the graph, you can restore the original setting of USS by inspecting the identifier. An example for the region dimension may clarify this:
- Region (t): check single and select 'world' (total; average;... for other dimensions)
- Region (a): select all regions except world
- Region (1): select one specific region
Note on range: right click on the graph area pops up the context menu with range options. The 'auto range' options adjusts the range to the displayed data.
How to explore maps
The spatial resolution of map indicators is based on 30 by 30 arc minutes (0.5 by 0.5 degree) world grid, except for the 'Land Cover' map in the 'State' box, which has a 5 by 5 arc minutes resolution.
The temporal resolution in USS is limited to start year plus the year set 2000,2025, 2050, 2075, 2100.
Data may be represented as a color range (for such ranges as millimeters per day) or as qualifiers (for such ranges as 'Land-cover types').
Time animation makes it possible to view the evolution of the current scenario over time up to the year 2100. The Time Manager is a tool for time animation. It can be accessed under the 'Tools' menu or by clicking the Time Manager symbol in the toolbar.
Grids with values beyond the color range will be displayed in black. You can adjust the range using the Range Dialog.
Right mouse click in the map area to pops up a dialog to zoom in on a specific region.
Note on spatial data: USS shows only a part of all spatial data and in a limited resolution. All spatial data are available on a higher temporal resolution and some also on a higher spatial resolution in netcdf format. These data are accessible via KNMI Data Center (KDC) for viewing and downloading.
How to load scenarios
The USS includes several scenarios (see the part on scenarios on the IMAGE_framework page).
When you start the USS, one scenario is loaded by default. You can load the other scenarios and select the one you are interested in.
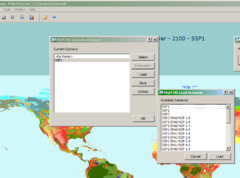
From the 'tools' menu, select 'Scenario Manager'.
A dialog with the following options pops up:
- Select: selects a scenario from the list.
- Load: opens the Window 'Load scenario' from where you can add scenarios to the list by loading them.
- Unload: unloads a scenario and removes it from the list.
Window 'Load Scenario' pops up with a list of all available scenarios. You can select a scenario and load it with the OK button. This scenario becomes the active scenario.
Now you can switch between scenarios by clicking on the Select button. Note that you have to highlight the scenario, then press the 'Select' and 'OK' buttons in order to select the scenario.
How to compare scenarios in graphs
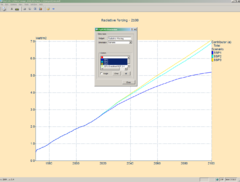
It is possible to compare different scenarios for one indicator in the same graph. To this end, load the scenarios to compare and zoom in on the indicator you want to compare.
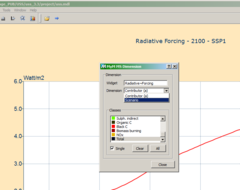
Access the Dimension Dialog. Every graph indicator has a scenario dimension apart from his own dimensions. Most indicators are defined over one or more dimensions, e.g. region dimension. For all own dimensions (selected from the pull down menu) 'single' should be checked.
Select Scenario... from the pull-down menu in the dimension dialog and uncheck 'single'. Now you can select the different scenarios you want to compare by highlighting them or pressing the 'All' button.
All loaded scenarios are displayed on the indicator graphs. You can compare the scenarios of each indicator.
Note on dimensions: When finished, restore the original setting of the dimensions and their selected classes. Otherwise the display of other indicators may become disturbed.
How to compare scenarios in a split-view
The split window function allows you to compare scenarios of an indicator by displaying two or more windows, each loaded with a different scenario.
The Window menu on the menu-bar contains the options:
- Horizontal Split, Vertical Split: splits the window
- Tile: distributes the windows. If you had altered the size of the split windows by dragging them, this option resets them to their original values.
- Join: Joins the selected window with the adjacent window(s).
You can split a window as often as you need to. Each window acts independently and offers you a copy of the USS. You can open another indicator or select another scenario for the same indicator in the new window.
Each window may be linked to another scenario, allowing you to make comparisons.
How to export data to Excel
Hover your cursor over the border area of a box or graph. Right mouse click and select the option:
- Save selection as Excel...: A data set will be created containing the data related to the lines in the graph (your item selection of the dimensions of the active data set). You can save the (xml) file onto your system.
- Save container as Excel...: A data set will be created containing all data of the selected graph or of all the graphs in the selected box of all loaded scenarios with the exception of the map data (see below).
How to obtain spatial IMAGE data
In this USS only a few spatial data sets are included in a limited version. All spatial data sets are available in netcdf format on KNMI Data Center (KDC).
