File:Technical potential maps renewables.png
Original file (2,728 × 2,516 pixels, file size: 1.01 MB, MIME type: image/png)
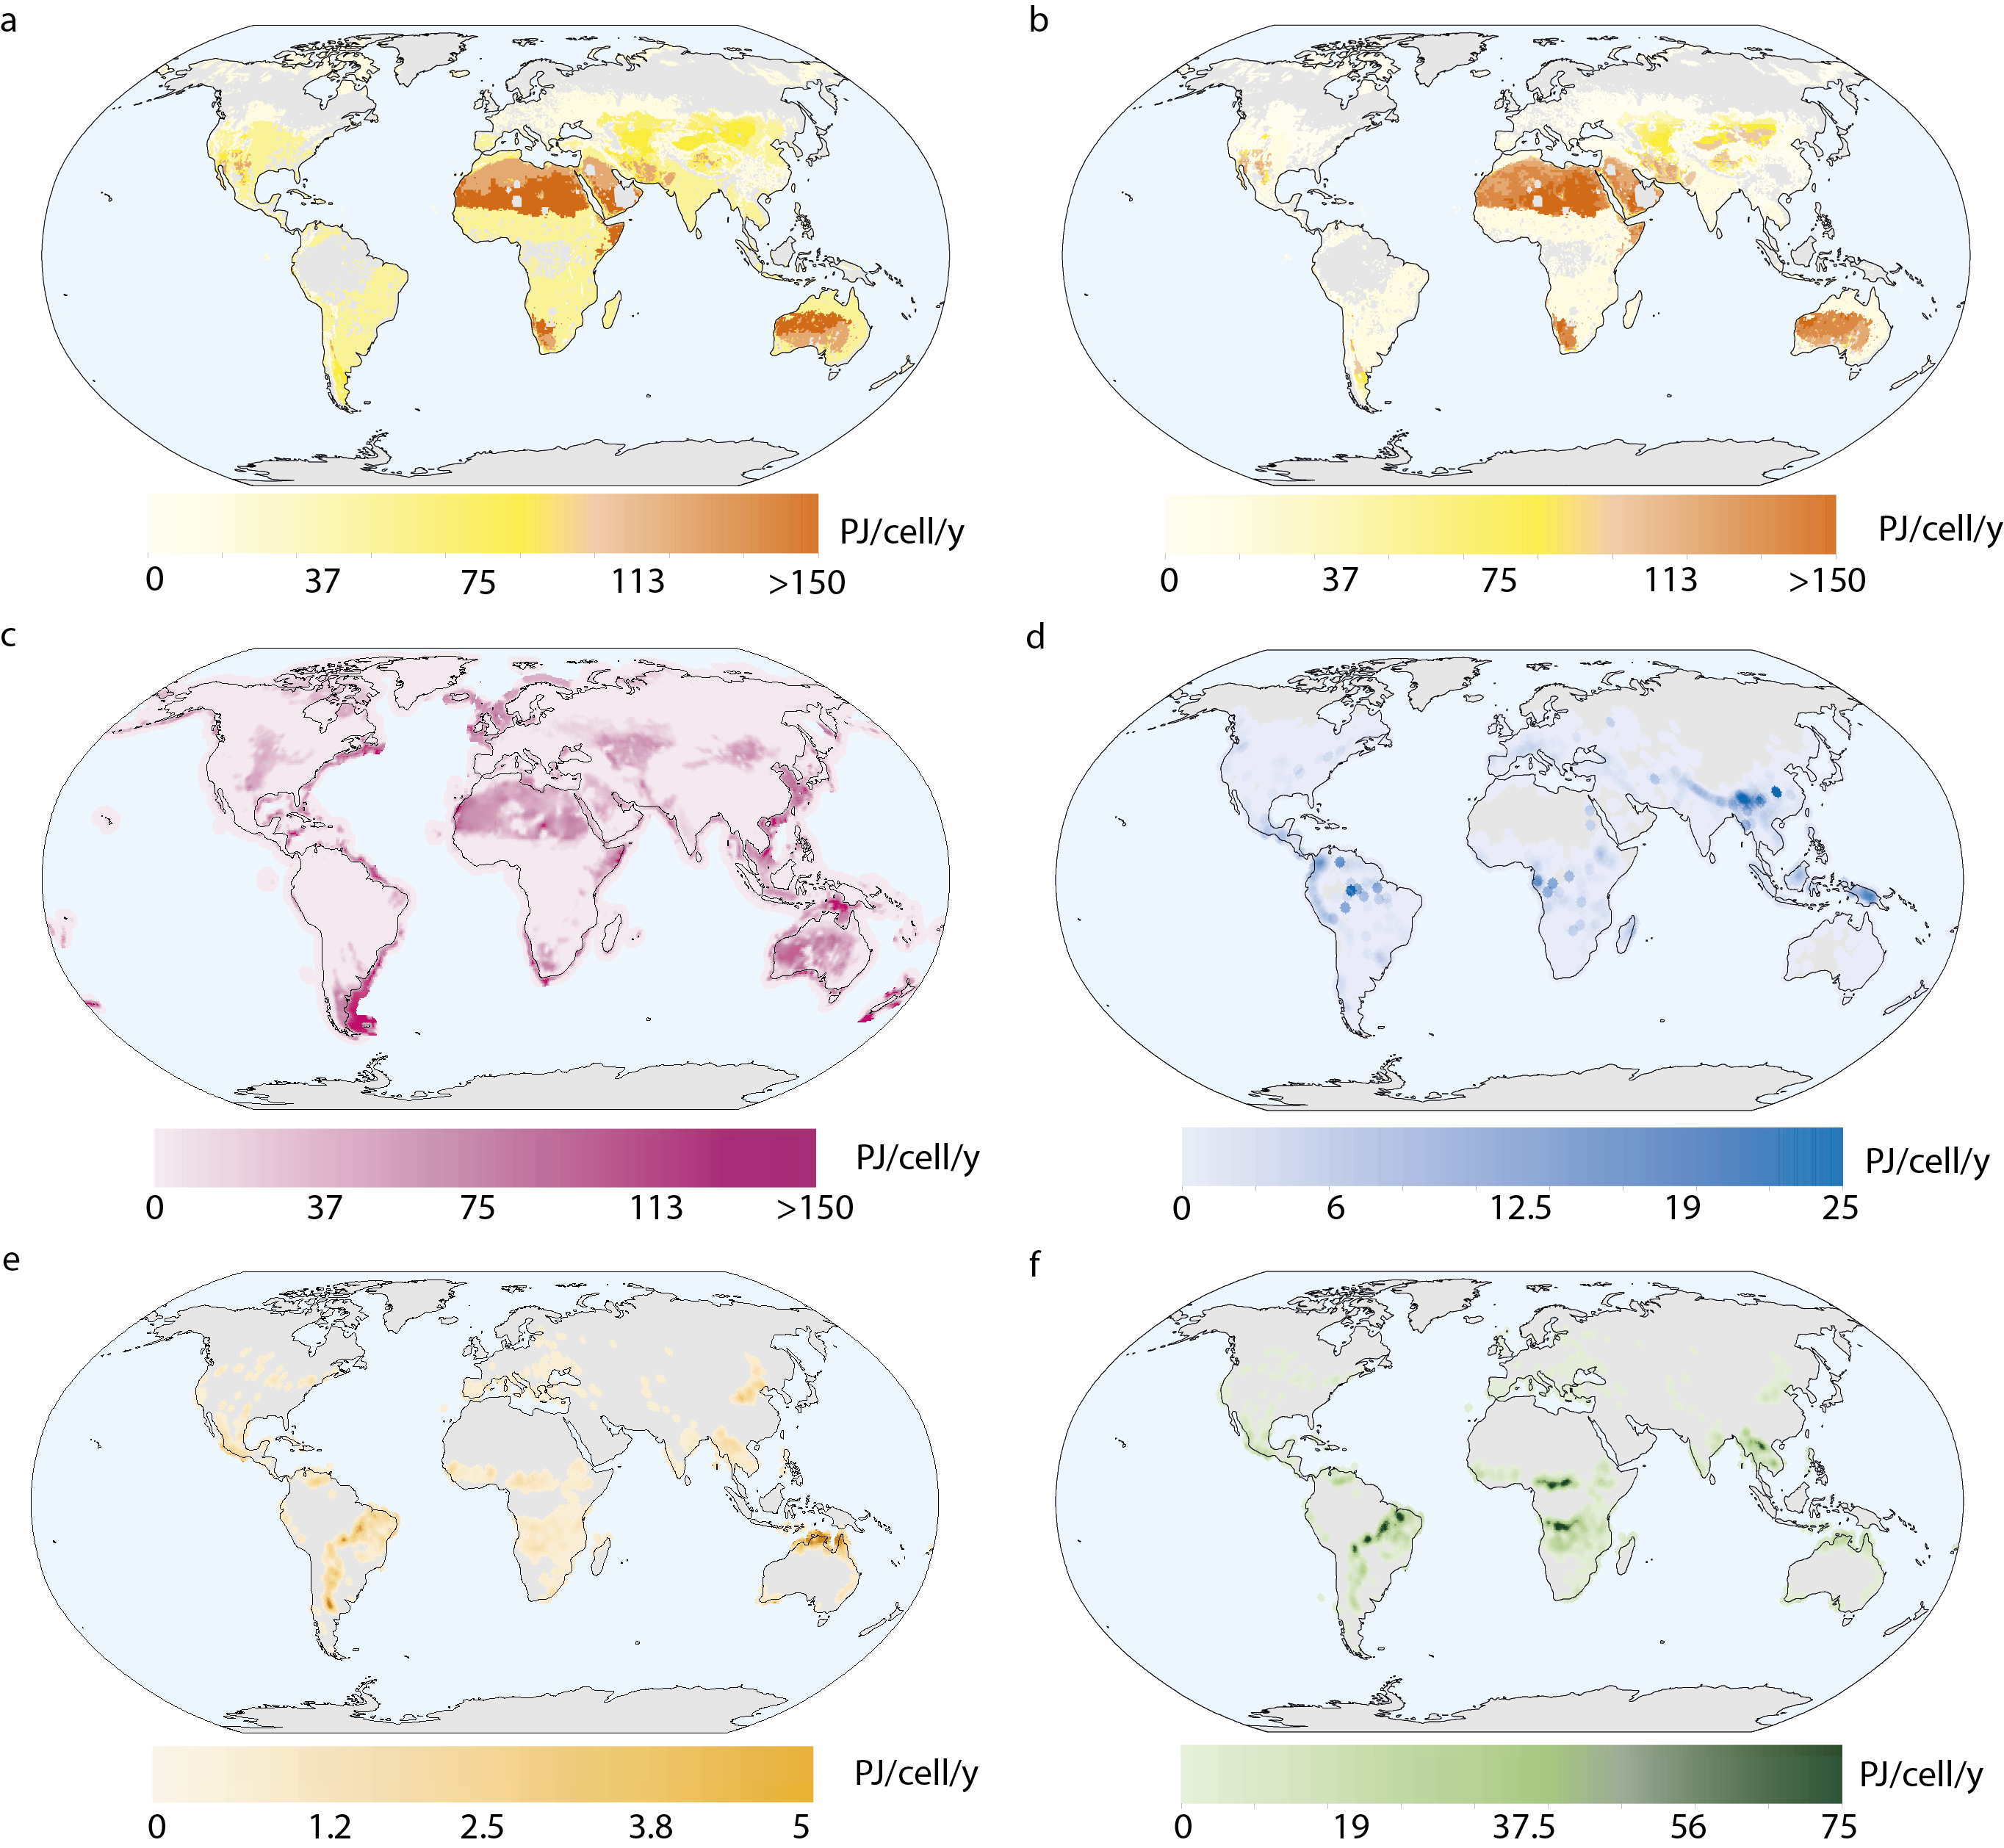
Global maps showing technical potential of renewable energy sources for 2010. Calculated with climate data from HadGEM2-ES (30y-average 1970-2000) and the suitability factors of Table 5-1. One cell has an area of 0.5°×0.5°. a, Solar PV (utility-scale PV) (based on Chapter 3 and Hoogwijk (2004), Köberle et al. (2015)). b, CSP (based on Köberle et al. (2015)). c, Wind (onshore and offshore) (based on Chapter 2 and Hoogwijk (2004)). d, Hydropower (defined as: remaining technical potential, explained and based on Chapter 4). e, 1st generation bio-energy (based on Daioglou et al. (2019), Hoogwijk (2004)). f, 2nd generation bio-energy (based on Daioglou et al. (2019), Hoogwijk (2004)). Note that the scales are different.
File history
Click on a date/time to view the file as it appeared at that time.
| Date/Time | Thumbnail | Dimensions | User | Comment | |
|---|---|---|---|---|---|
| current | 15:54, 25 April 2019 | | 2,728 × 2,516 (1.01 MB) | Gernaatd (talk | contribs) |
You cannot overwrite this file.
File usage
The following page uses this file: