Unused files
Jump to navigation
Jump to search
The following files exist but are not embedded in any page. Please note that other web sites may link to a file with a direct URL, and so may still be listed here despite being in active use.
Showing below up to 50 results in range #151 to #200.
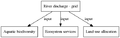 River discharge grid digraph QueryResult dot.png 560 × 176; 11 KB
 SO2 emissions digraph QueryResult dot.png 580 × 179; 11 KB
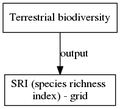 SRI species richness index grid digraph QueryResult dot.png 197 × 179; 6 KB
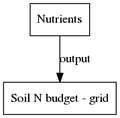 Soil N budget grid digraph QueryResult dot.png 179 × 176; 5 KB
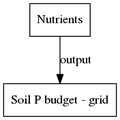 Soil P budget grid digraph QueryResult dot.png 176 × 176; 4 KB
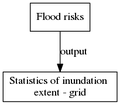 Statistics of inundation extent grid digraph QueryResult dot.png 205 × 179; 5 KB
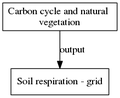 Soil respiration grid digraph QueryResult dot.png 219 × 179; 6 KB
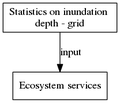 Statistics on inundation depth grid digraph QueryResult dot.png 208 × 179; 6 KB
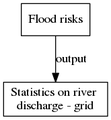 Statistics on river discharge grid digraph QueryResult dot.png 165 × 179; 5 KB
 Temperature grid digraph QueryResult dot.png 864 × 132; 17 KB
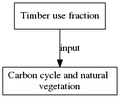 Timber use fraction digraph QueryResult dot.png 219 × 179; 6 KB
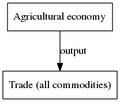 Trade all commodities digraph QueryResult dot.png 208 × 176; 6 KB
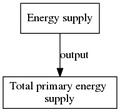 Total primary energy supply digraph QueryResult dot.png 192 × 179; 6 KB
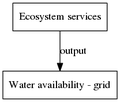 Water availability grid digraph QueryResult dot.png 208 × 176; 6 KB
 Water stress grid digraph QueryResult dot.png 168 × 176; 4 KB
 Wilderness area grid digraph QueryResult dot.png 197 × 176; 6 KB
 Water withdrawal other sectors grid digraph QueryResult dot.png 469 × 181; 11 KB
 Accessibility grid digraph QueryResult dot.png 401 × 176; 10 KB
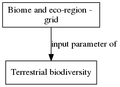 Biome and eco region grid digraph QueryResult dot.png 247 × 179; 7 KB
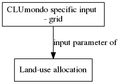 CLUmondo specific input grid digraph QueryResult dot.png 255 × 179; 7 KB
 Coastal storm surges digraph QueryResult dot.png 233 × 176; 6 KB
 Conversion assumptions digraph QueryResult dot.png 257 × 176; 7 KB
 Digital water network grid digraph QueryResult dot.png 381 × 179; 10 KB
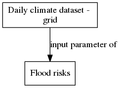 Daily climate dataset grid digraph QueryResult dot.png 243 × 179; 6 KB
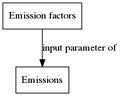 Emission factors digraph QueryResult dot.png 219 × 176; 5 KB
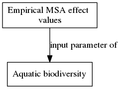 Empirical MSA effect values digraph QueryResult dot.png 241 × 179; 8 KB
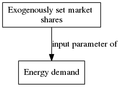 Exogenously set market shares digraph QueryResult dot.png 248 × 179; 7 KB
 FAO deforestation rates digraph QueryResult dot.png 244 × 176; 6 KB
 Fish landing grid digraph QueryResult dot.png 228 × 176; 6 KB
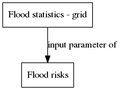 Flood statistics grid digraph QueryResult dot.png 235 × 176; 6 KB
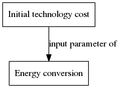 Initial technology cost digraph QueryResult dot.png 239 × 176; 6 KB
 Initial production costs digraph QueryResult dot.png 241 × 176; 6 KB
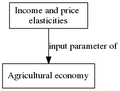 Income and price elasticities digraph QueryResult dot.png 237 × 179; 7 KB
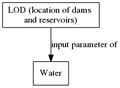 LOD location of dams and reservoirs digraph QueryResult dot.png 245 × 179; 7 KB
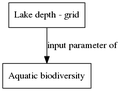 Lake depth grid digraph QueryResult dot.png 232 × 176; 7 KB
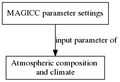 MAGICC parameter settings digraph QueryResult dot.png 263 × 179; 8 KB
 MSA effect values digraph QueryResult dot.png 240 × 176; 7 KB
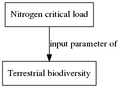 Nitrogen critical load digraph QueryResult dot.png 240 × 176; 7 KB
 No go areas grid digraph QueryResult dot.png 228 × 176; 6 KB
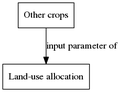 Other crops digraph QueryResult dot.png 229 × 176; 6 KB
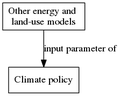 Other energy and land use models digraph QueryResult dot.png 223 × 179; 7 KB
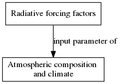 Radiative forcing factors digraph QueryResult dot.png 255 × 179; 8 KB
 Regression parameters digraph QueryResult dot.png 240 × 176; 6 KB
 Residue management digraph QueryResult dot.png 236 × 176; 6 KB
 Road map grid digraph QueryResult dot.png 240 × 176; 6 KB


