File:Dataflow overview interaction components digraph QueryResult dot.png
Jump to navigation
Jump to search
Size of this preview: 355 × 599 pixels. Other resolution: 1,347 × 2,273 pixels.
Original file (1,347 × 2,273 pixels, file size: 328 KB, MIME type: image/png)
ImageMap
When including this image in a wiki page, use the following mark-up to enable links:
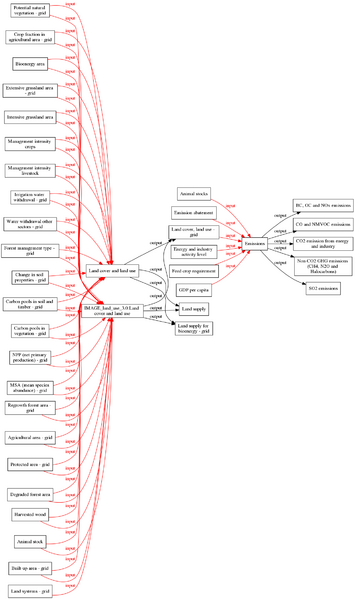
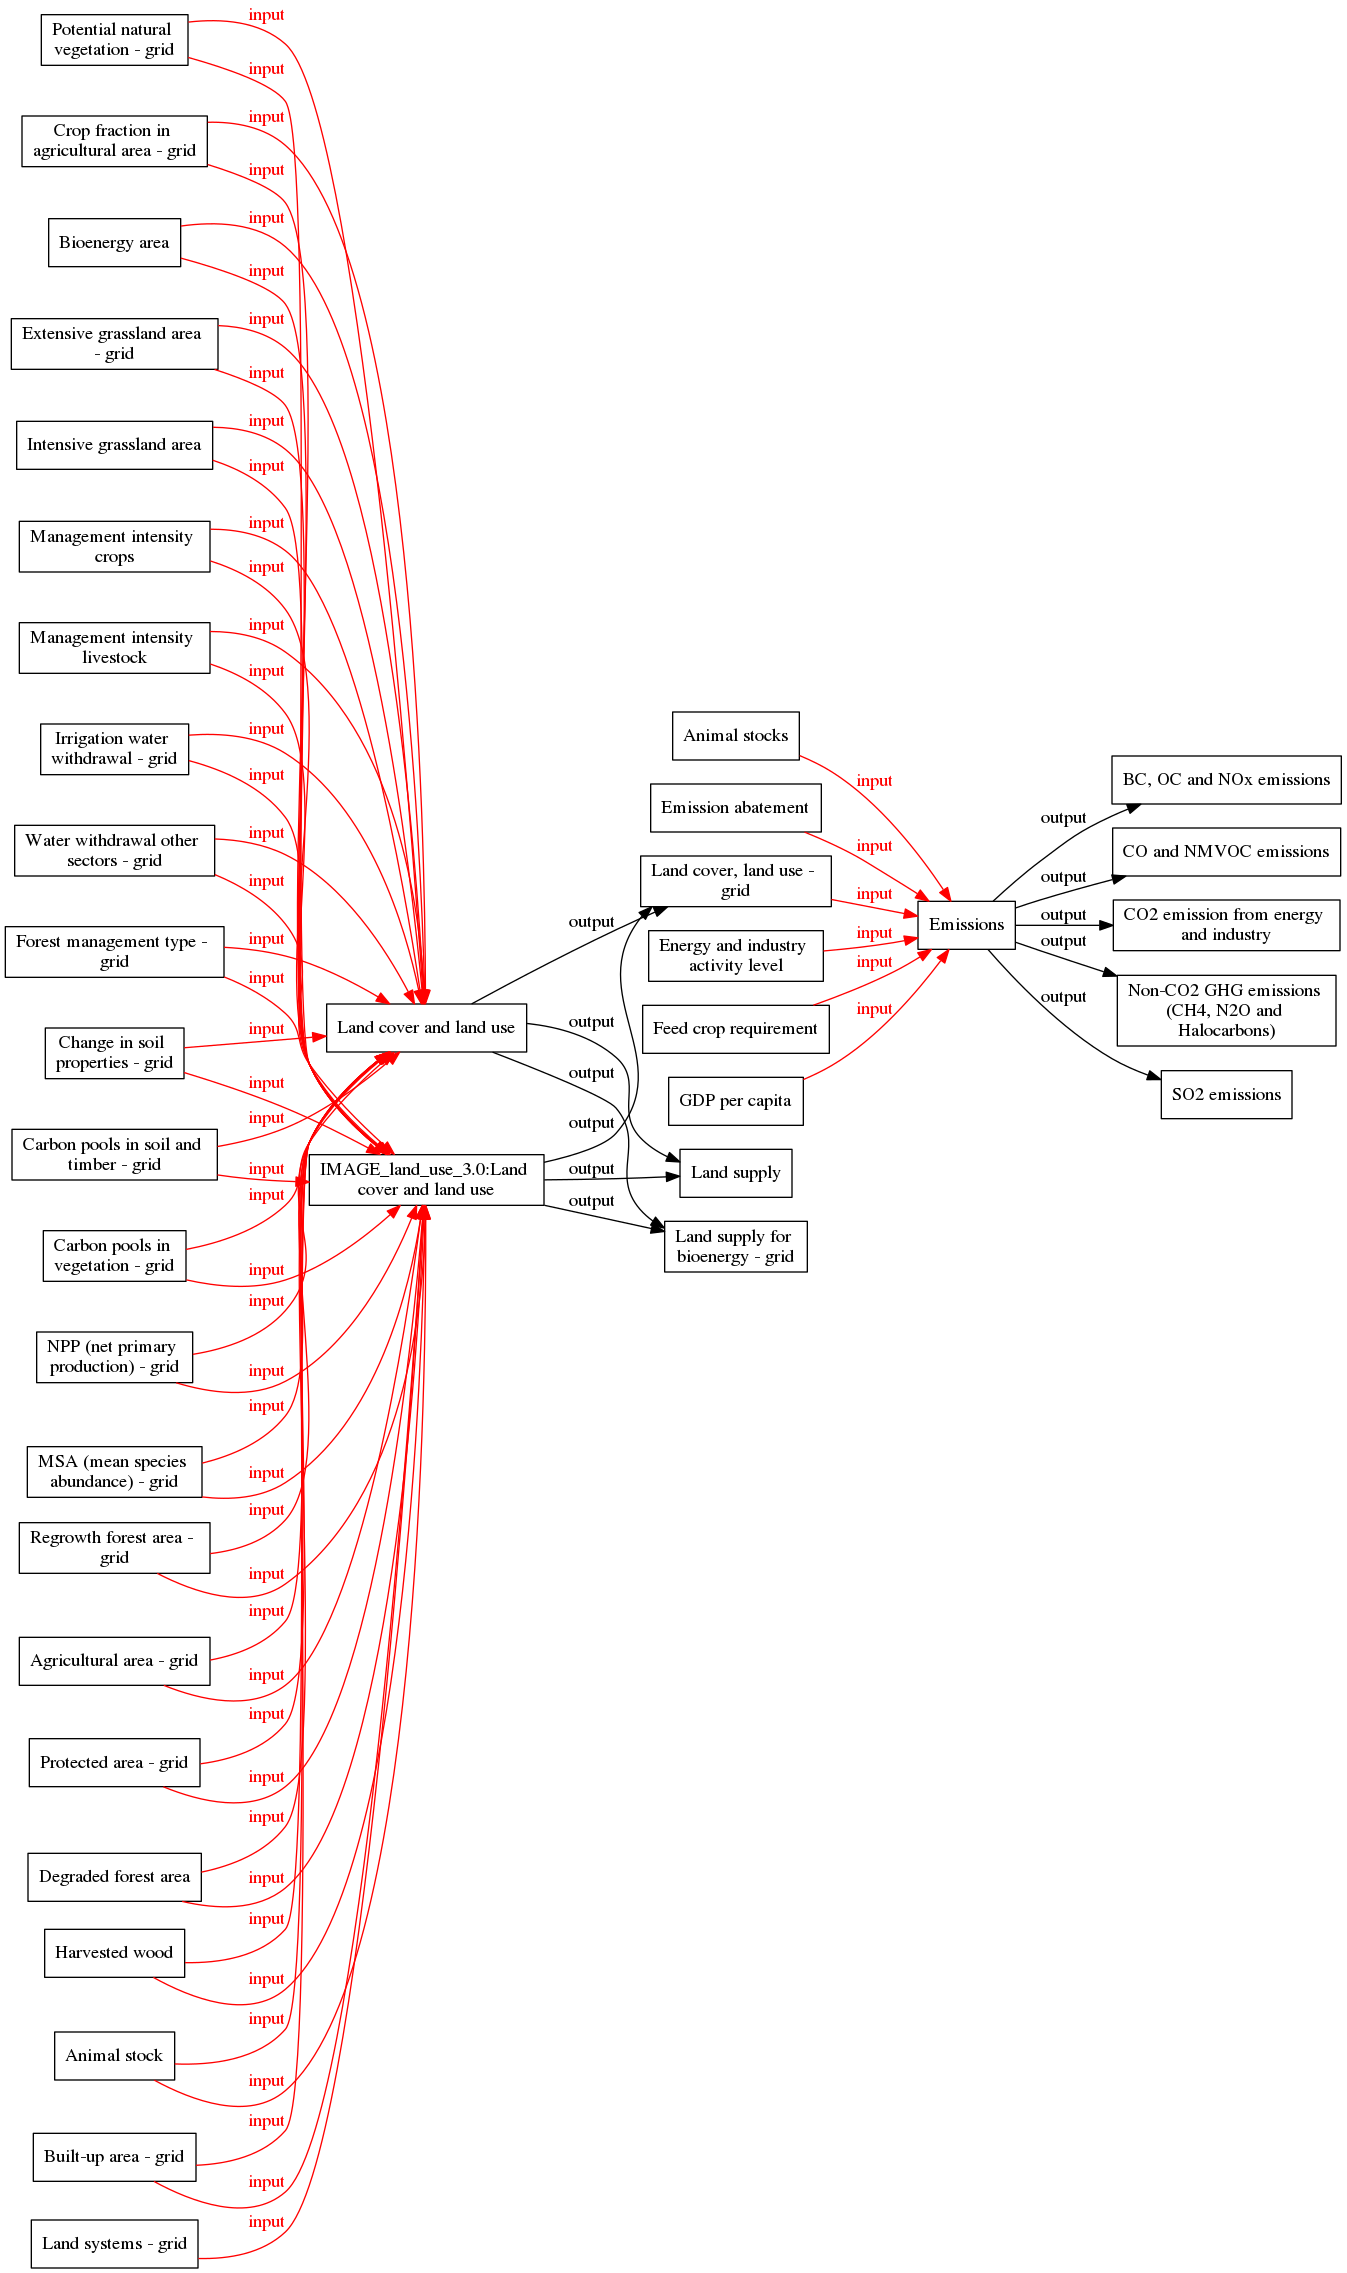
<imagemap>
File:Dataflow_overview___interaction_components_digraph_QueryResult_dot.png
rect 1112 756 1341 804 [[BC  OC and NOx emissions]]
rect 918 901 1015 949 [[Emissions]]
rect 1113 828 1341 876 [[CO and NMVOC emissions]]
rect 1113 900 1340 951 [[CO2 emission from energy and industry]]
rect 1117 975 1336 1046 [[Non-CO2 GHG emissions (CH4  N2O and Halocarbons)]]
rect 1161 1071 1292 1119 [[SO2 emissions]]
rect 673 712 799 760 [[Animal stocks]]
rect 651 784 821 832 [[Emission abatement]]
rect 641 856 831 907 [[Land cover  land use - grid]]
rect 649 931 823 981 [[Energy and industry activity level]]
rect 643 1005 829 1053 [[Feed crop requirement]]
rect 669 1077 803 1125 [[GDP per capita]]
rect 327 1004 527 1052 [[Land cover and land use]]
rect 680 1149 792 1197 [[Land supply]]
rect 665 1221 807 1272 [[Land supply for bioenergy - grid]]
rect 41 15 188 65 [[Potential natural vegetation - grid]]
rect 309 1155 544 1205 [[IMAGE_land_use_3.0:Land cover and land use]]
rect 22 116 207 167 [[Crop fraction in agricultural area - grid]]
rect 49 219 181 267 [[Bioenergy area]]
rect 11 319 218 369 [[Extensive grassland area - grid]]
rect 17 421 213 469 [[Intensive grassland area]]
rect 19 521 210 572 [[Management intensity crops]]
rect 19 623 210 673 [[Management intensity livestock]]
rect 41 724 189 775 [[Irrigation water withdrawal - grid]]
rect 15 825 215 876 [[Water withdrawal other sectors - grid]]
rect 5 927 224 977 [[Forest management type - grid]]
rect 45 1028 184 1079 [[Change in soil properties - grid]]
rect 12 1129 217 1180 [[Carbon pools in soil and timber - grid]]
rect 43 1231 186 1281 [[Carbon pools in vegetation - grid]]
rect 37 1332 193 1383 [[NPP (net primary production) - grid]]
rect 27 1447 202 1497 [[MSA (mean species abundance) - grid]]
rect 19 1523 210 1573 [[Regrowth forest area - grid]]
rect 19 1637 210 1685 [[Agricultural area - grid]]
rect 29 1739 200 1787 [[Protected area - grid]]
rect 28 1853 201 1901 [[Degraded forest area]]
rect 45 1929 185 1977 [[Harvested wood]]
rect 55 2032 175 2080 [[Animal stock]]
rect 33 2133 196 2181 [[Built-up area - grid]]
rect 31 2220 198 2268 [[Land systems - grid]]</imagemap>
See ImageMap for more information.
File history
Click on a date/time to view the file as it appeared at that time.
| Date/Time | Thumbnail | Dimensions | User | Comment | |
|---|---|---|---|---|---|
| current | 18:45, 2 June 2017 | | 1,347 × 2,273 (328 KB) | Oostenrijr (talk | contribs) | generated by the GraphViz extension from the Dataflow overview - interaction components page |
You cannot overwrite this file.
File usage
There are no pages that use this file.