File:Dataflow overview pressure components digraph pressure components dot.png
Jump to navigation
Jump to search

Size of this preview: 800 × 529 pixels. Other resolution: 1,920 × 1,269 pixels.
Original file (1,920 × 1,269 pixels, file size: 307 KB, MIME type: image/png)
ImageMap
When including this image in a wiki page, use the following mark-up to enable links:
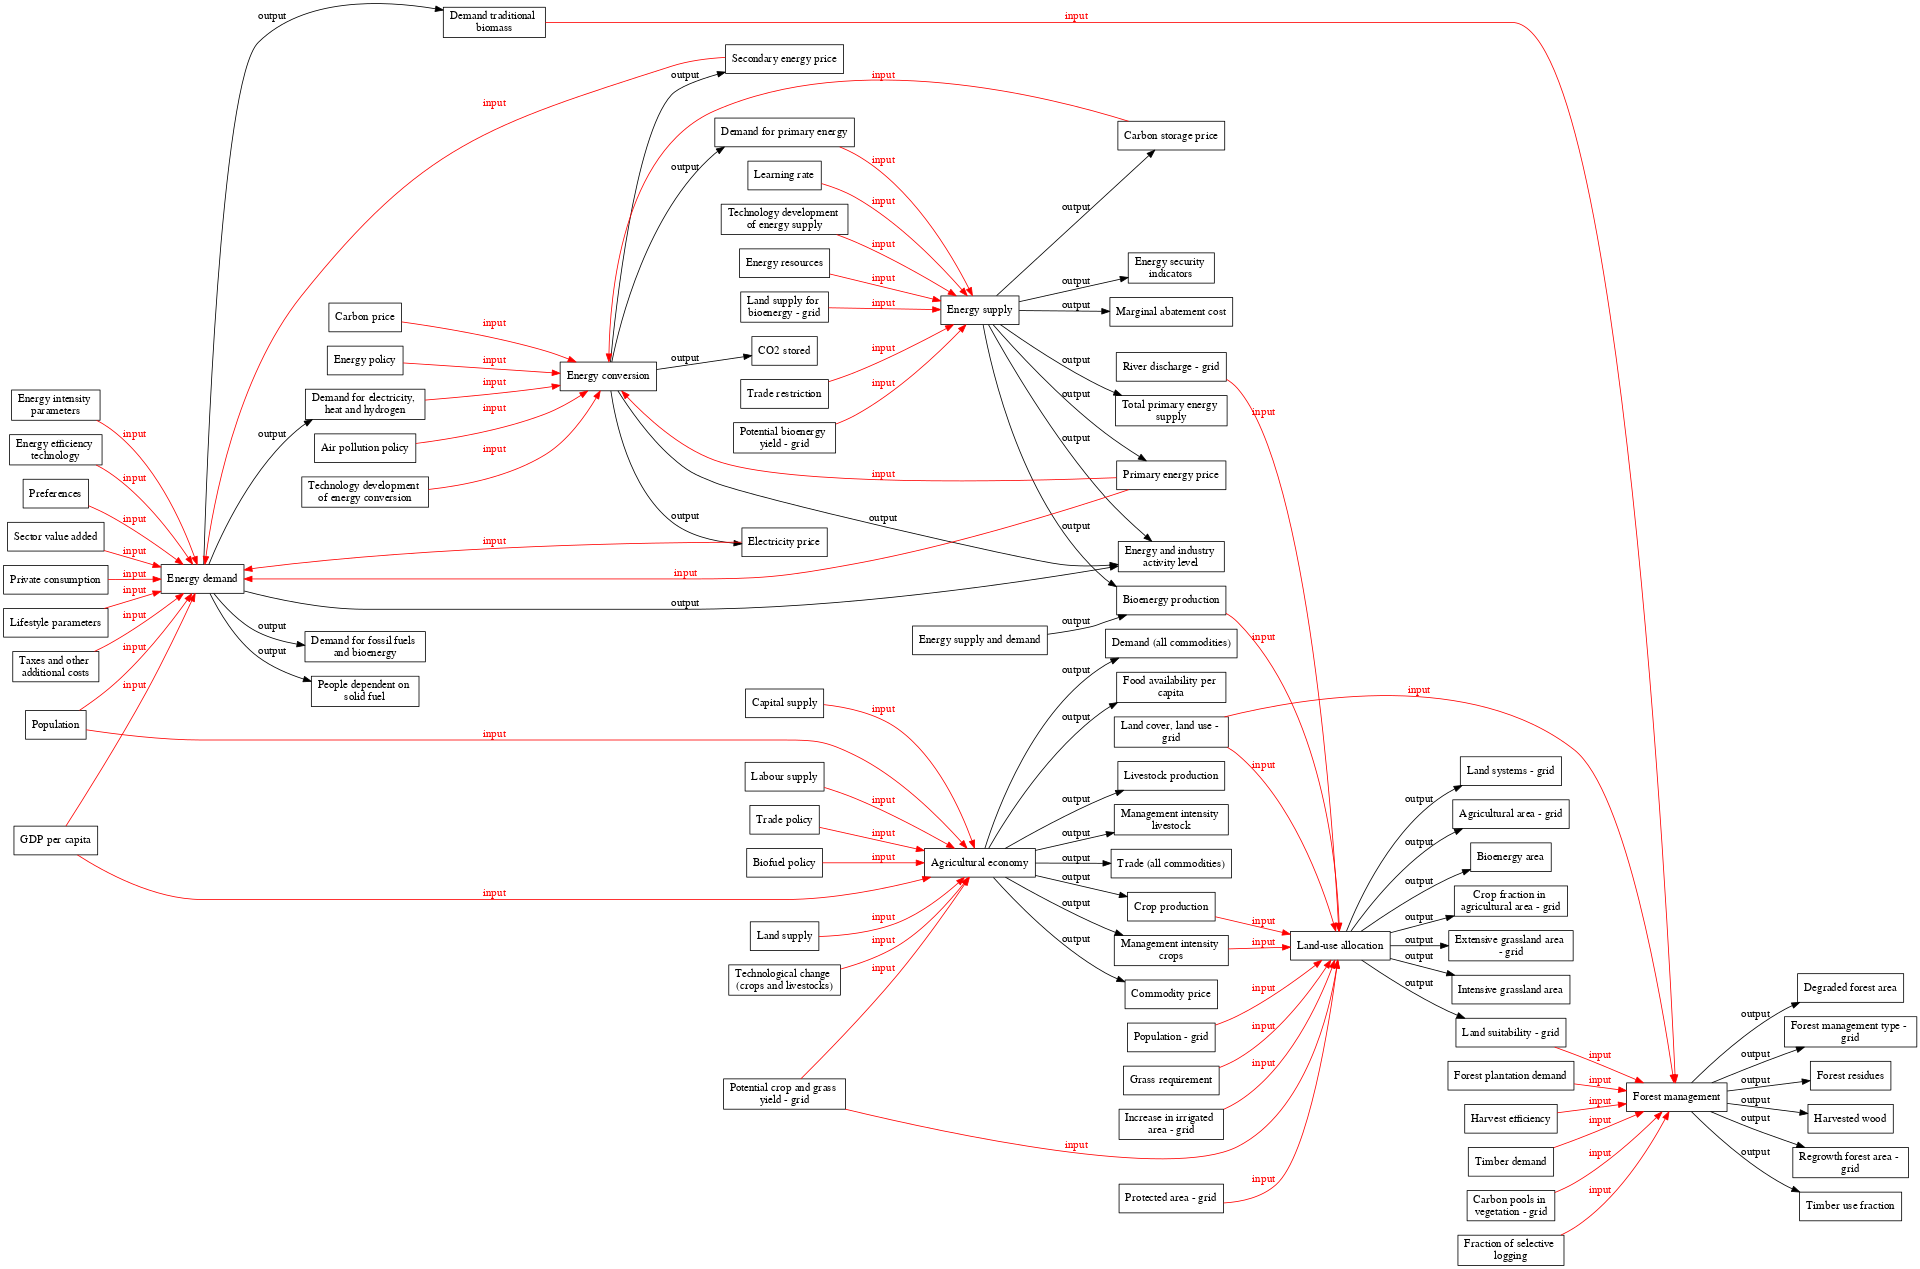
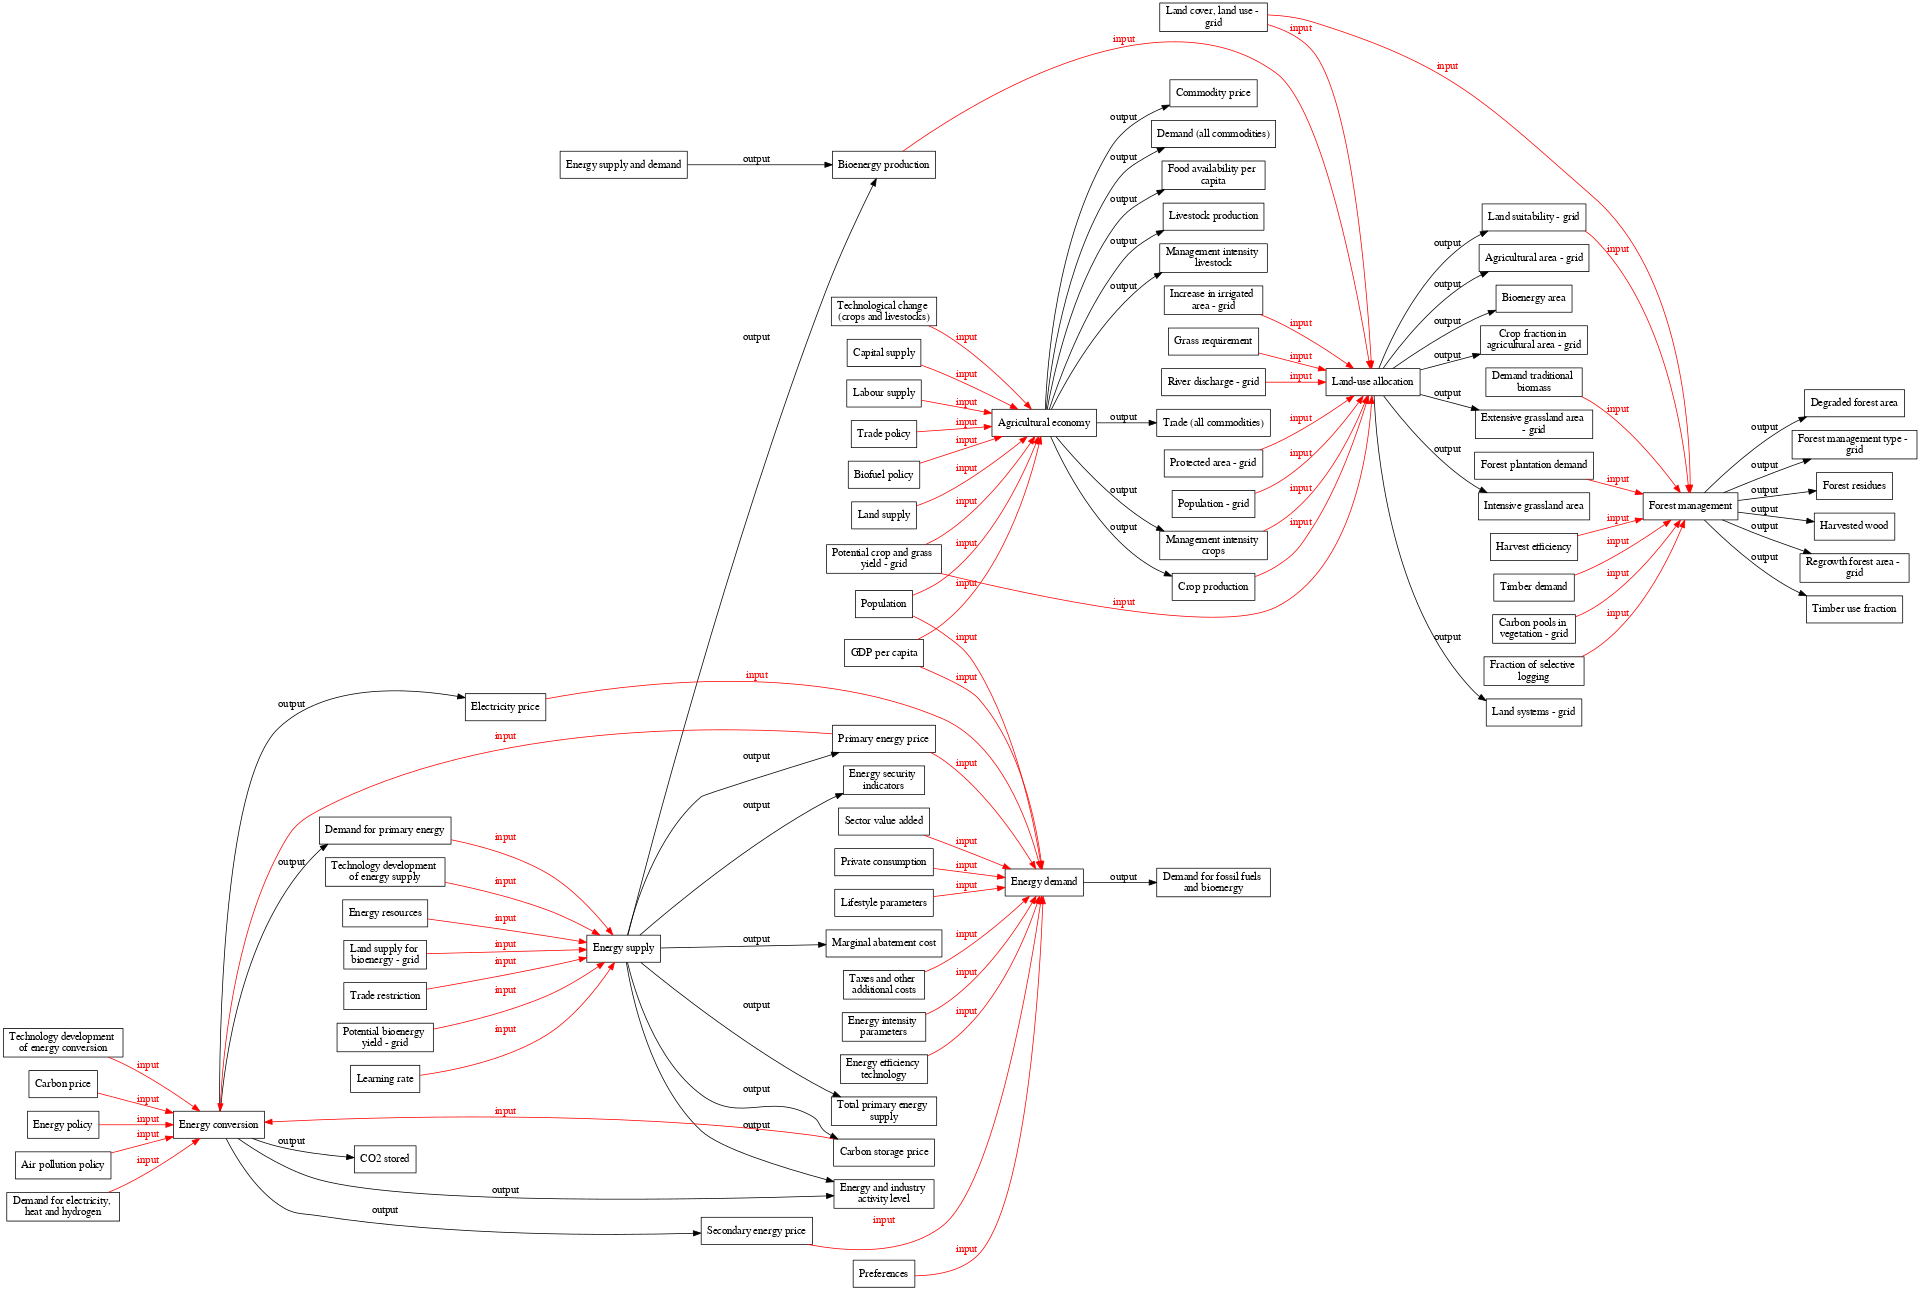
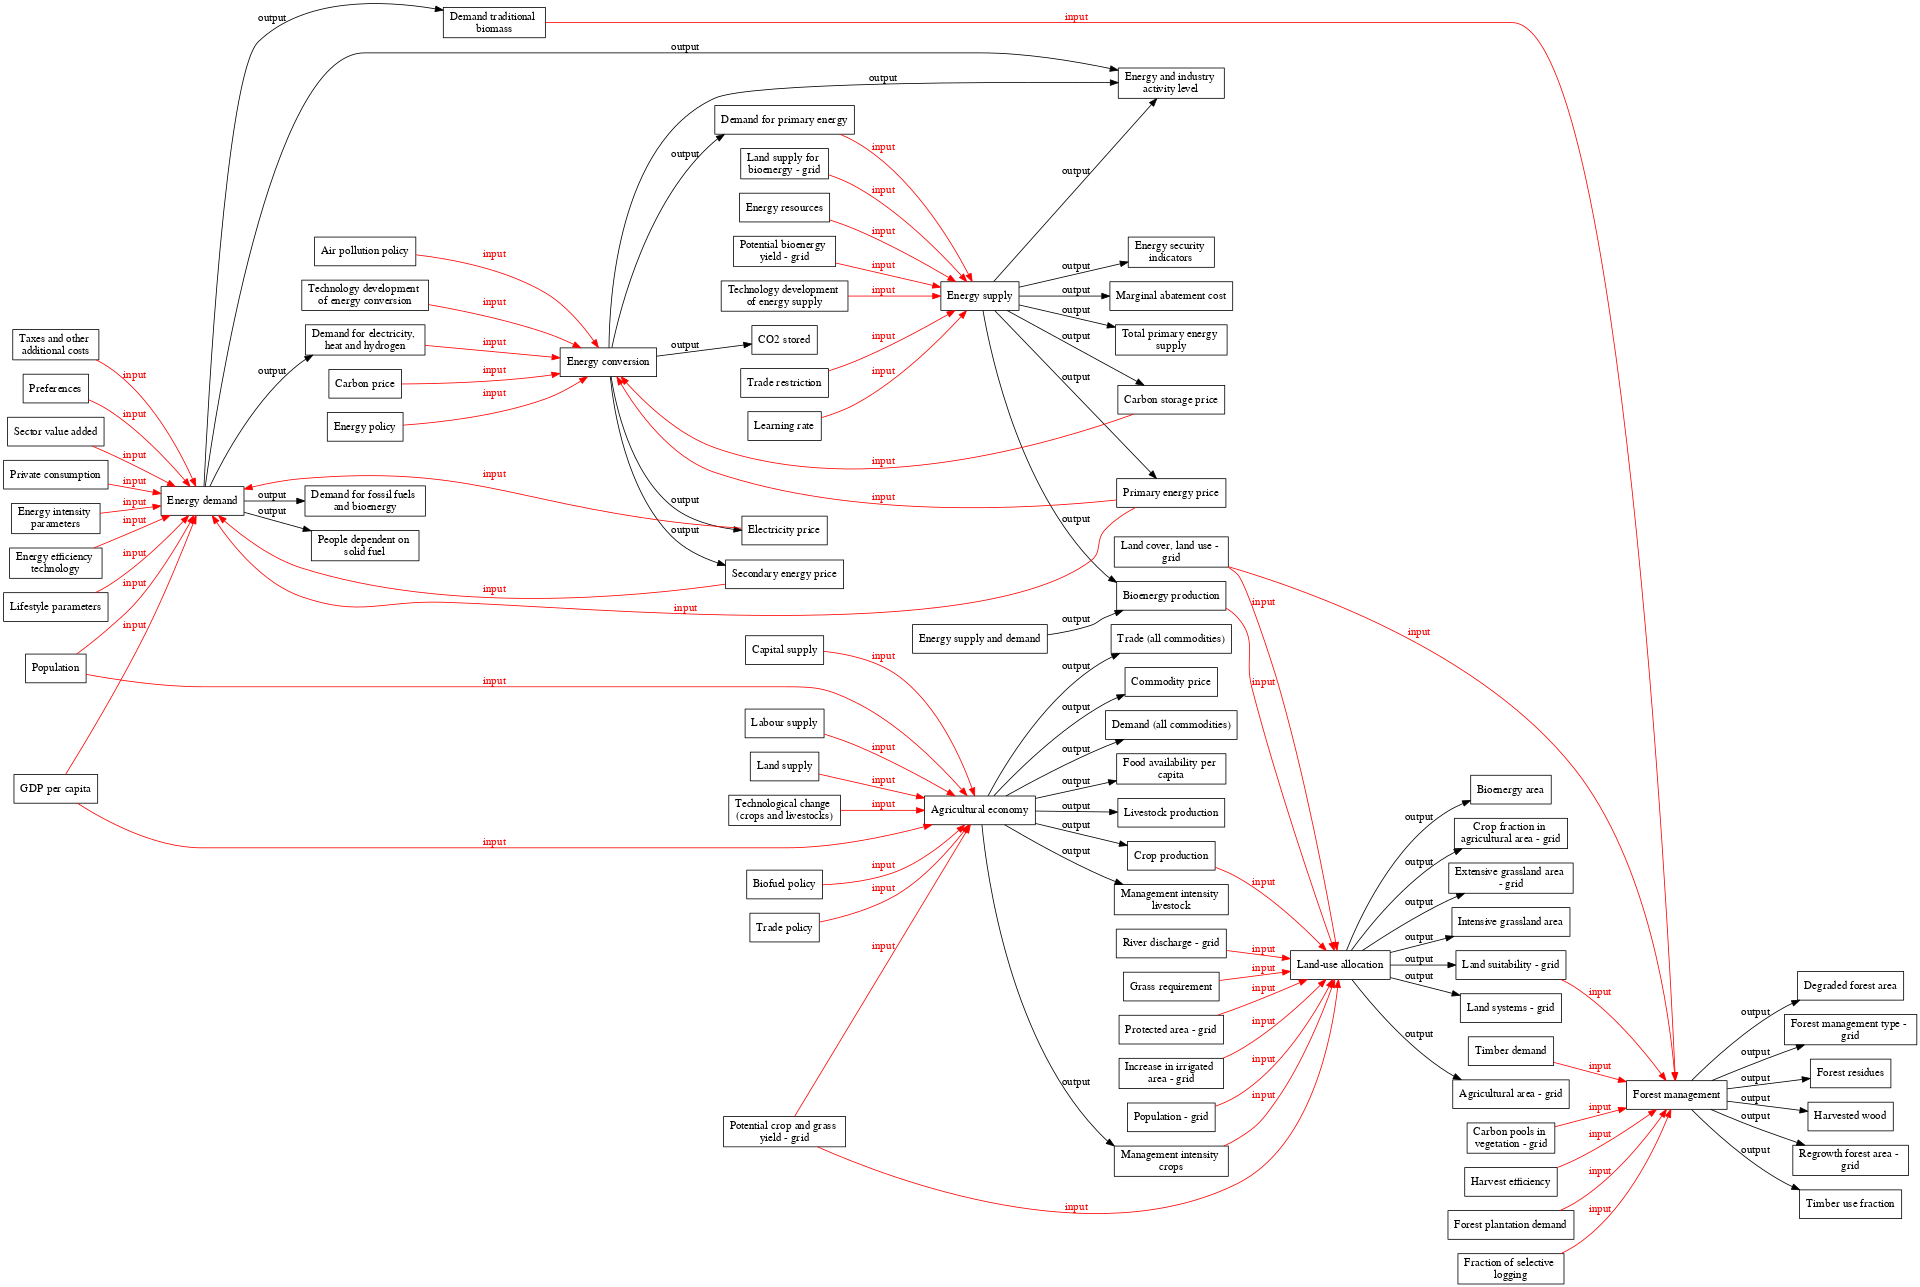
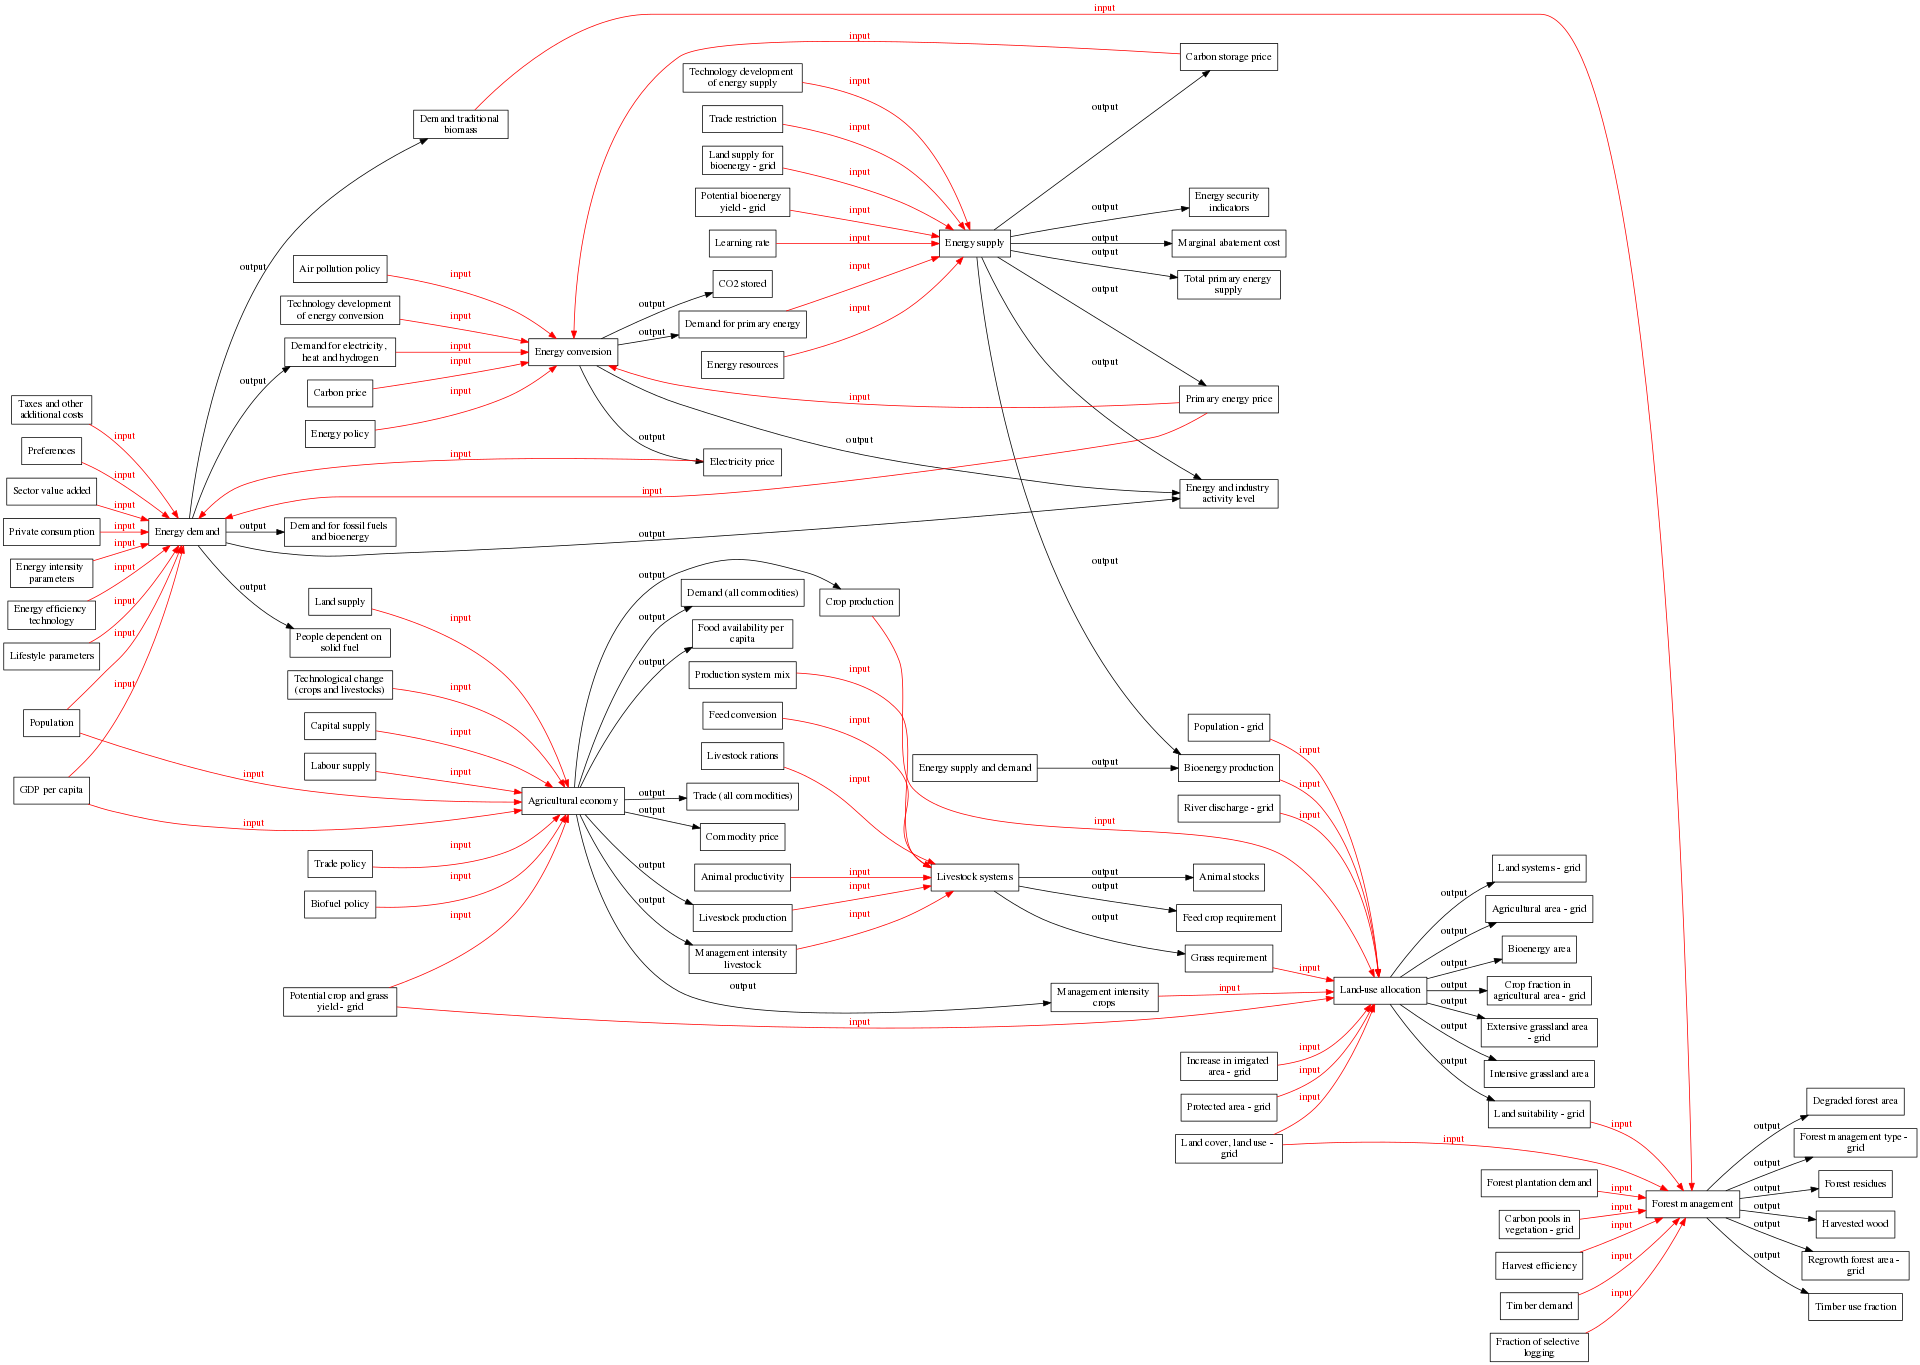
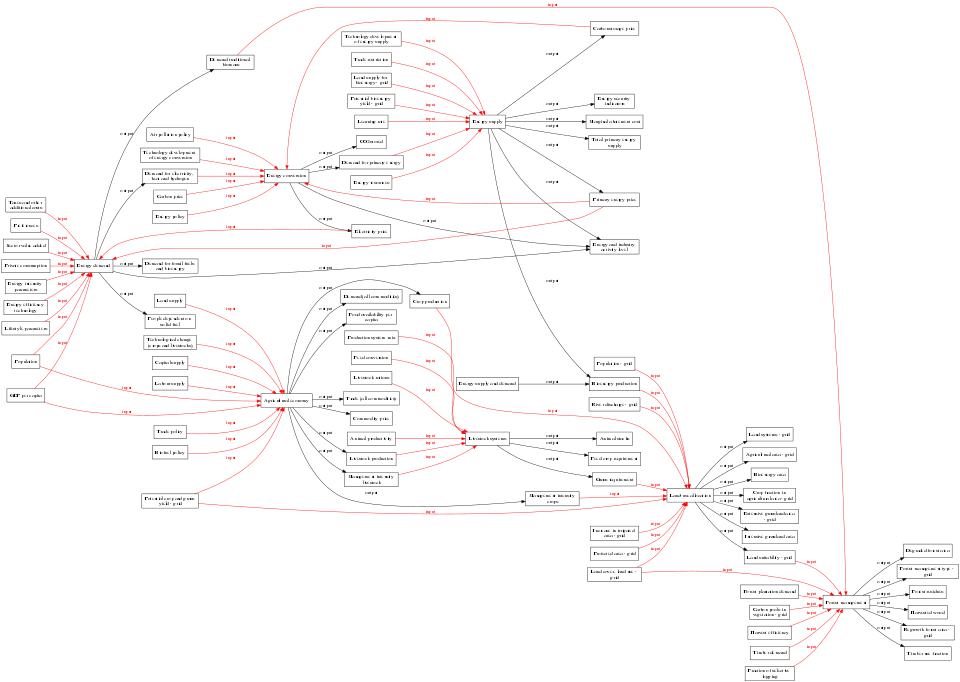
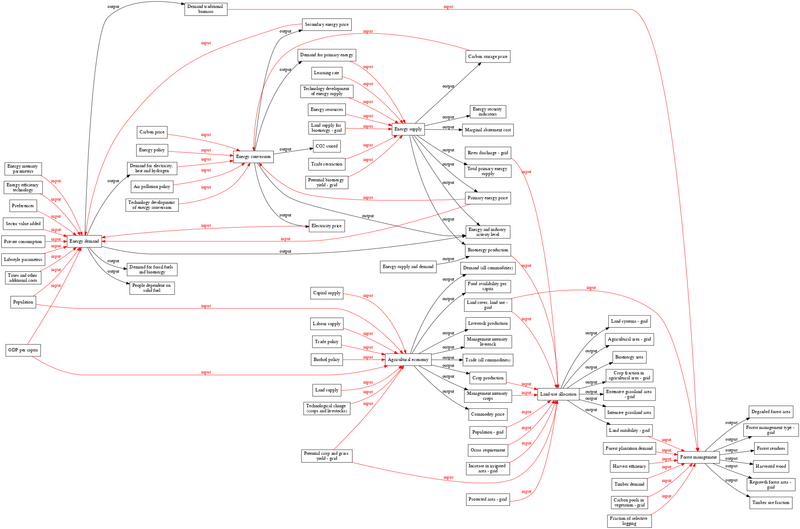
<imagemap>
File:Dataflow_overview___pressure_components_digraph_pressure_components_dot.png
rect 1486 896 1593 923 [[Agricultural area - grid]]
rect 1334 977 1427 1004 [[Land-use allocation]]
rect 1502 936 1576 963 [[Bioenergy area]]
rect 1487 976 1591 1005 [[Crop fraction in agricultural area - grid]]
rect 1481 1018 1597 1047 [[Extensive grassland area - grid]]
rect 1484 1060 1594 1087 [[Intensive grassland area]]
rect 1488 1101 1590 1128 [[Land suitability - grid]]
rect 1492 855 1586 882 [[Land systems - grid]]
rect 522 788 625 815 [[Agricultural economy]]
rect 700 824 785 851 [[Commodity price]]
rect 820 589 899 616 [[Crop production]]
rect 681 579 804 606 [[Demand (all commodities)]]
rect 692 620 793 648 [[Food availability per capita]]
rect 693 905 792 932 [[Livestock production]]
rect 1051 983 1158 1012 [[Management intensity crops]]
rect 689 945 796 973 [[Management intensity livestock]]
rect 687 783 799 810 [[Trade (all commodities)]]
rect 24 710 80 737 [[Population]]
rect 149 519 226 546 [[Energy demand]]
rect 14 777 90 804 [[GDP per capita]]
rect 305 713 376 740 [[Capital supply]]
rect 305 753 376 780 [[Labour supply]]
rect 308 851 372 878 [[Trade policy]]
rect 305 891 376 918 [[Biofuel policy]]
rect 309 588 372 615 [[Land supply]]
rect 284 988 397 1016 [[Potential crop and grass yield - grid]]
rect 288 671 393 699 [[Technological change (crops and livestocks)]]
rect 1193 864 1265 891 [[Animal stocks]]
rect 931 864 1019 891 [[Livestock systems]]
rect 1177 905 1281 932 [[Feed crop requirement]]
rect 1185 945 1273 972 [[Grass requirement]]
rect 1178 755 1280 782 [[Bioenergy production]]
rect 939 230 1011 257 [[Energy supply]]
rect 1180 43 1278 70 [[Carbon storage price]]
rect 1180 480 1278 508 [[Energy and industry activity level]]
rect 1189 188 1269 217 [[Energy security indicators]]
rect 1172 230 1286 257 [[Marginal abatement cost]]
rect 1180 386 1279 413 [[Primary energy price]]
rect 1178 271 1280 299 [[Total primary energy supply]]
rect 913 755 1037 782 [[Energy supply and demand]]
rect 713 271 772 298 [[CO2 stored]]
rect 529 339 618 366 [[Energy conversion]]
rect 679 311 806 338 [[Demand for primary energy]]
rect 704 449 782 476 [[Electricity price]]
rect 1807 1088 1904 1115 [[Degraded forest area]]
rect 1646 1191 1740 1218 [[Forest management]]
rect 1794 1129 1917 1157 [[Forest management type - grid]]
rect 1819 1171 1892 1198 [[Forest residues]]
rect 1816 1211 1895 1238 [[Harvested wood]]
rect 1802 1252 1909 1280 [[Regrowth forest area - grid]]
rect 1809 1293 1902 1320 [[Timber use fraction]]
rect 285 338 396 366 [[Demand for electricity  heat and hydrogen]]
rect 284 518 396 546 [[Demand for fossil fuels and bioenergy]]
rect 414 110 508 139 [[Demand traditional biomass]]
rect 290 629 390 657 [[People dependent on solid fuel]]
rect 308 380 373 407 [[Carbon price]]
rect 305 420 375 447 [[Energy policy]]
rect 293 256 387 283 [[Air pollution policy]]
rect 281 296 400 324 [[Technology development of energy conversion]]
rect 7 478 97 505 [[Sector value added]]
rect 3 519 100 546 [[Private consumption]]
rect 10 559 93 588 [[Energy intensity parameters]]
rect 8 601 96 630 [[Energy efficiency technology]]
rect 4 643 100 670 [[Lifestyle parameters]]
rect 12 396 92 424 [[Taxes and other additional costs]]
rect 22 438 82 465 [[Preferences]]
rect 701 351 784 378 [[Energy resources]]
rect 683 64 802 92 [[Technology development of energy supply]]
rect 703 106 783 133 [[Trade restriction]]
rect 703 146 783 175 [[Land supply for bioenergy - grid]]
rect 695 188 790 217 [[Potential bioenergy yield - grid]]
rect 709 230 776 257 [[Learning rate]]
rect 1175 1135 1283 1163 [[Land cover  land use - grid]]
rect 1481 1170 1597 1197 [[Forest plantation demand]]
rect 1499 1210 1579 1239 [[Carbon pools in vegetation - grid]]
rect 1496 1252 1583 1279 [[Harvest efficiency]]
rect 1500 1293 1578 1320 [[Timber demand]]
rect 1490 1333 1588 1362 [[Fraction of selective logging]]
rect 1181 1052 1277 1081 [[Increase in irrigated area - grid]]
rect 1181 1094 1277 1121 [[Protected area - grid]]
rect 1188 714 1270 741 [[Population - grid]]
rect 1178 795 1280 822 [[River discharge - grid]]
rect 689 662 796 689 [[Production system mix]]
rect 703 702 782 729 [[Feed conversion]]
rect 701 743 784 770 [[Livestock rations]]
rect 695 864 791 891 [[Animal productivity]]</imagemap>
See ImageMap for more information.
File history
Click on a date/time to view the file as it appeared at that time.


You cannot overwrite this file.
File usage
The following page uses this file: