Policy intervention figure Aquatic biodiversity: Difference between revisions
Jump to navigation
Jump to search
(Created page with "{{FigurePageTemplate |Figure=102x_img13.png |Caption=Map of the mean freshwater MSA for 2000 and 2050 (OECD baseline scenario) (from PBL, 2009). |Component=Aquatic biodiversit...") |
Oostenrijr (talk | contribs) m (Oostenrijr moved page Policy intervention figure AB to Policy intervention figure Aquatic biodiversity without leaving a redirect: Text replace - " AB" to " Aquatic biodiversity") |
||
| (9 intermediate revisions by 2 users not shown) | |||
| Line 1: | Line 1: | ||
{{ | {{FigureTemplate | ||
|Figure= | |Figure=170k img13.png | ||
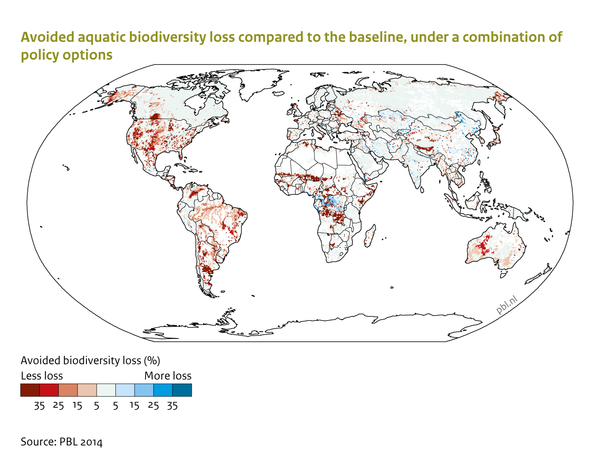
|Caption= | |AltText=Avoided aquatic biodiversity loss compared to the baseline, under a combination of policy options | ||
|Component=Aquatic biodiversity; | |Caption=A set of ambitious policy options could reduce aquatic biodiversity loss compared to a baseline scenario. | ||
|FigureType=Policy intervention figure | |||
|OptimalSize=600 | |||
|Component=Aquatic biodiversity; | |||
}} | }} | ||
Latest revision as of 14:54, 23 June 2014
Caption: A set of ambitious policy options could reduce aquatic biodiversity loss compared to a baseline scenario.
Figure is used on page(s): Aquatic biodiversity