Baseline figure Aquatic biodiversity: Difference between revisions
Jump to navigation
Jump to search

m (Text replace - "FigurePage" to "Figure") |
No edit summary |
||
| Line 4: | Line 4: | ||
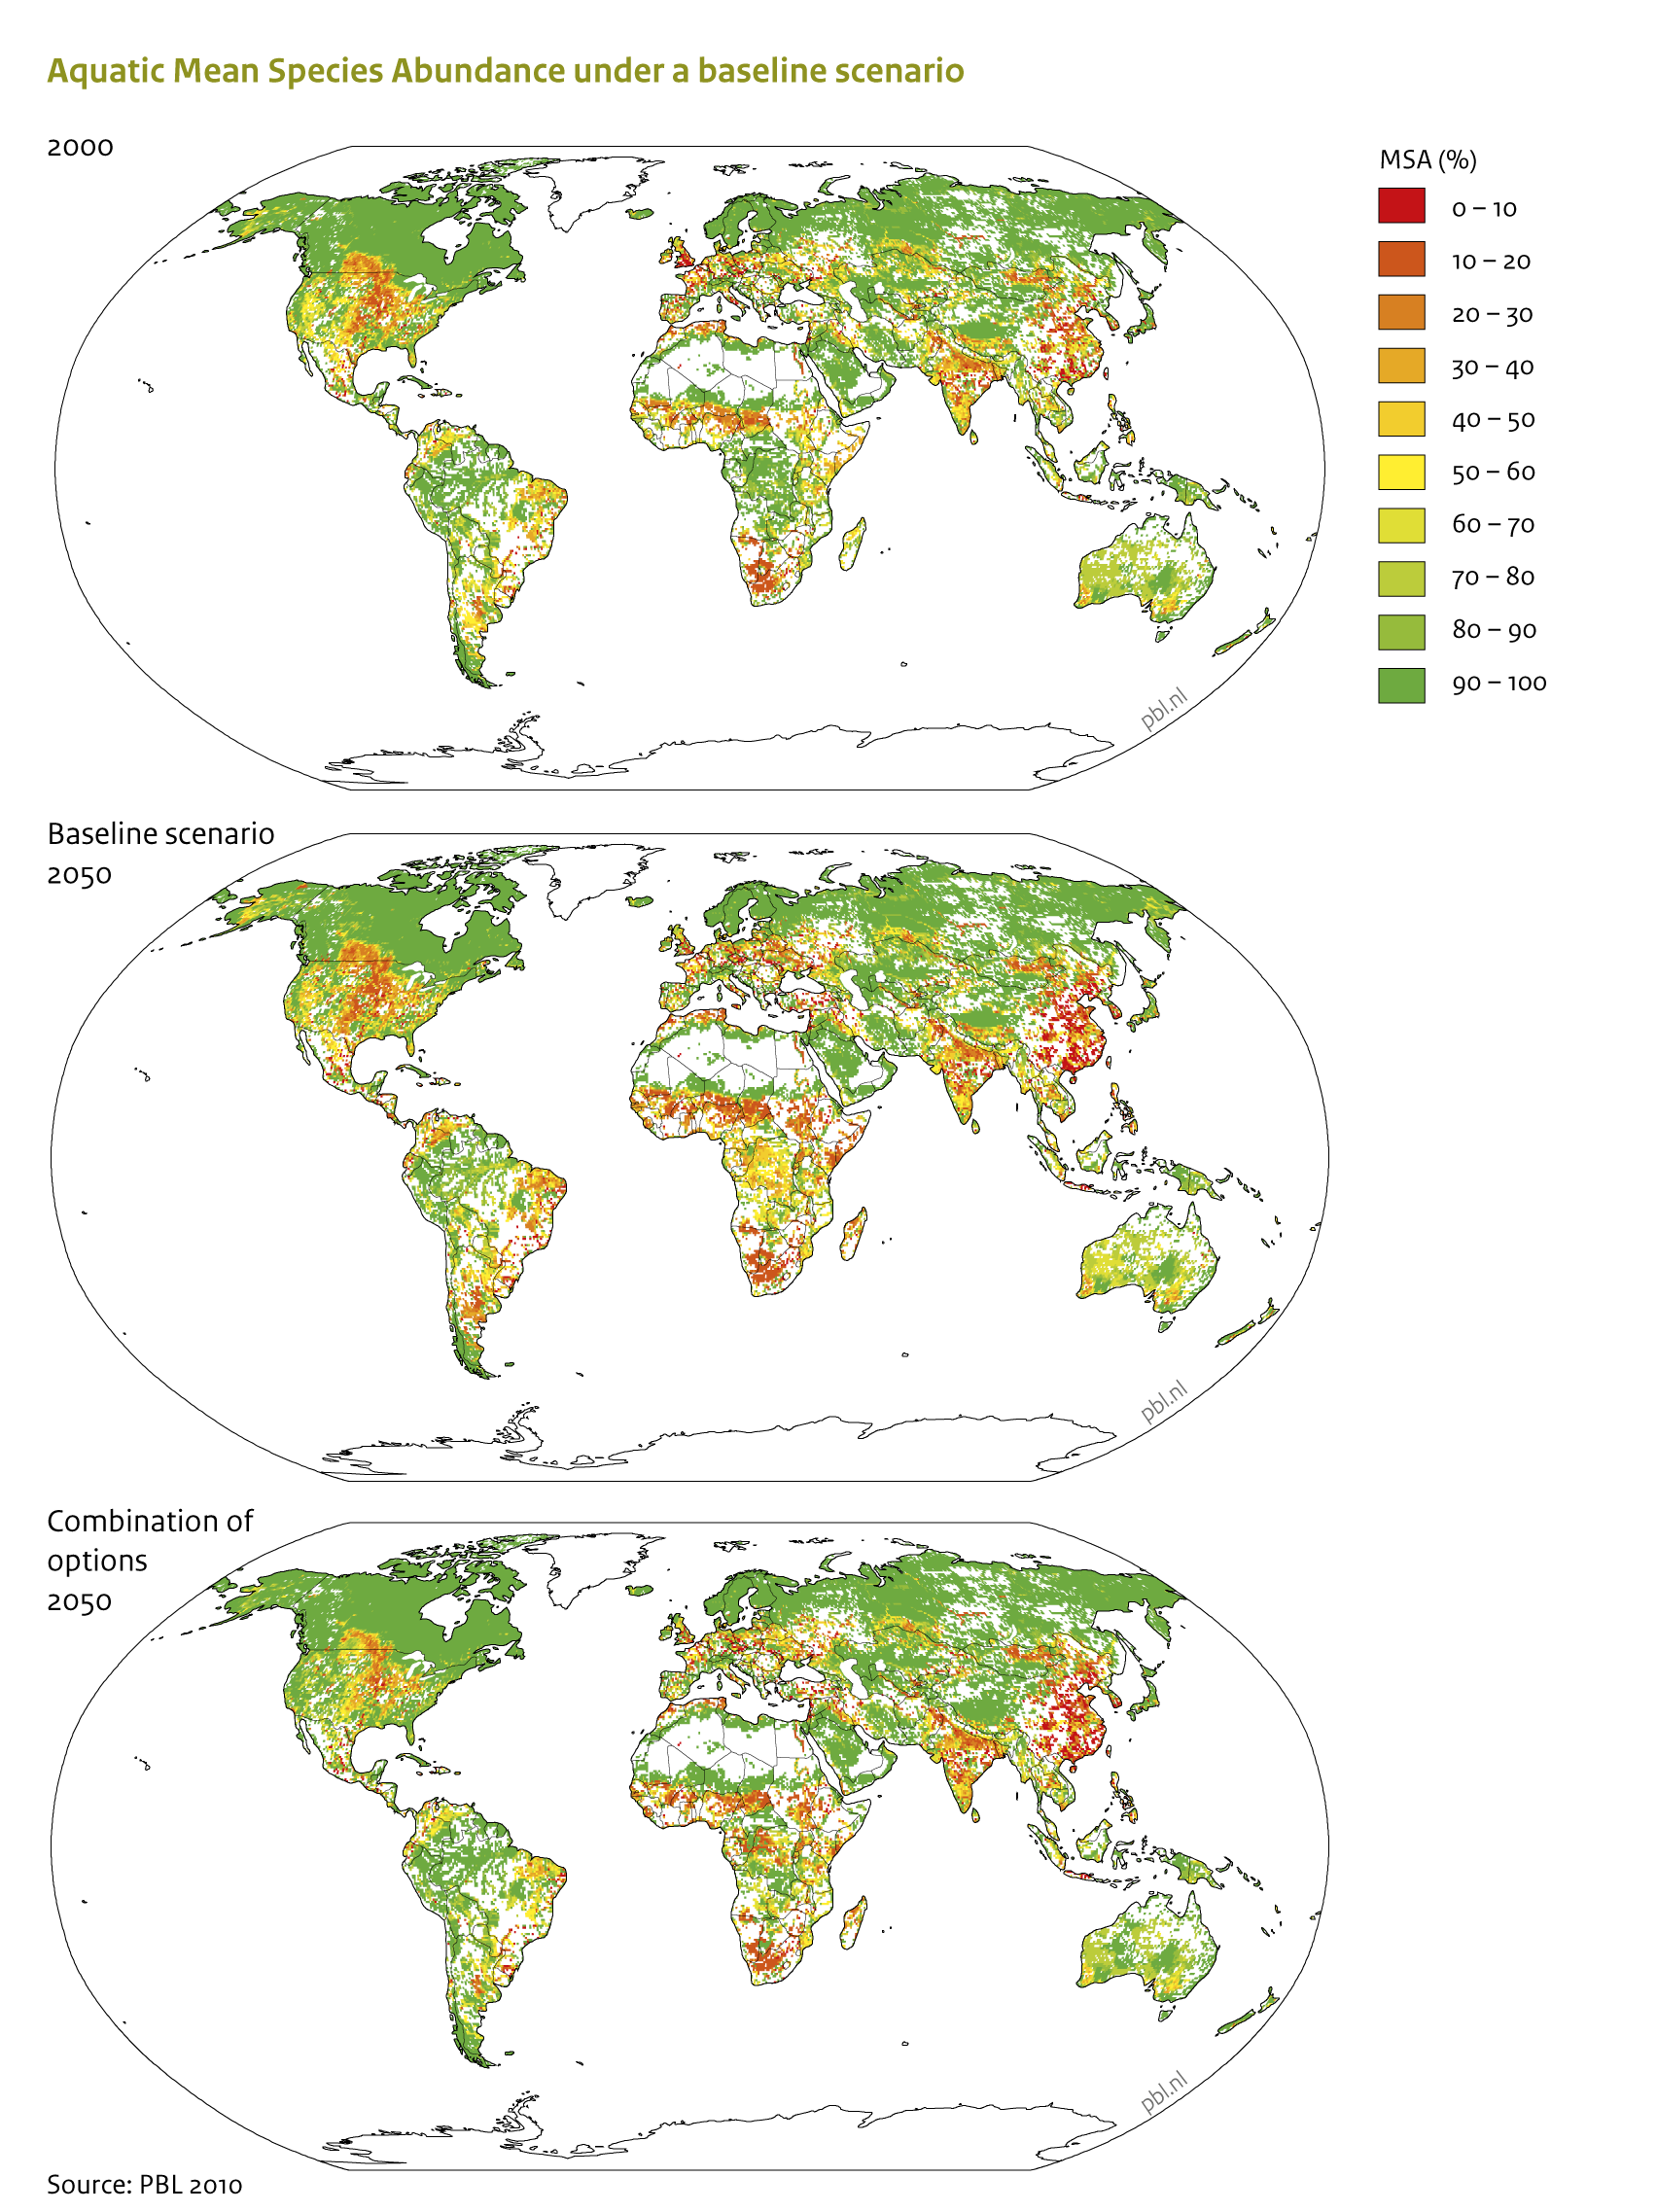
|Caption=Map of the mean freshwater MSA for 2000 and 2050 (OECD baseline scenario) (PBL, 2010). | |Caption=Map of the mean freshwater MSA for 2000 and 2050 (OECD baseline scenario) (PBL, 2010). | ||
|FigureType=Baseline figure | |FigureType=Baseline figure | ||
|OptimalSize=600 | |||
|Component=Aquatic biodiversity; | |Component=Aquatic biodiversity; | ||
}} | }} | ||
Revision as of 10:45, 18 May 2014
Caption: Map of the mean freshwater MSA for 2000 and 2050 (OECD baseline scenario) (PBL, 2010).
Figure is used on page(s): Aquatic biodiversity