Baseline figure Crops and grass

From IMAGE
Revision as of 10:30, 1 July 2014 by Oostenrijr (talk | contribs) (Text replace - "CO<sub>2</sub>" to "CO<sub>2</sub> ")
(diff) ← Older revision | Latest revision (diff) | Newer revision → (diff)
Jump to navigation Jump to search


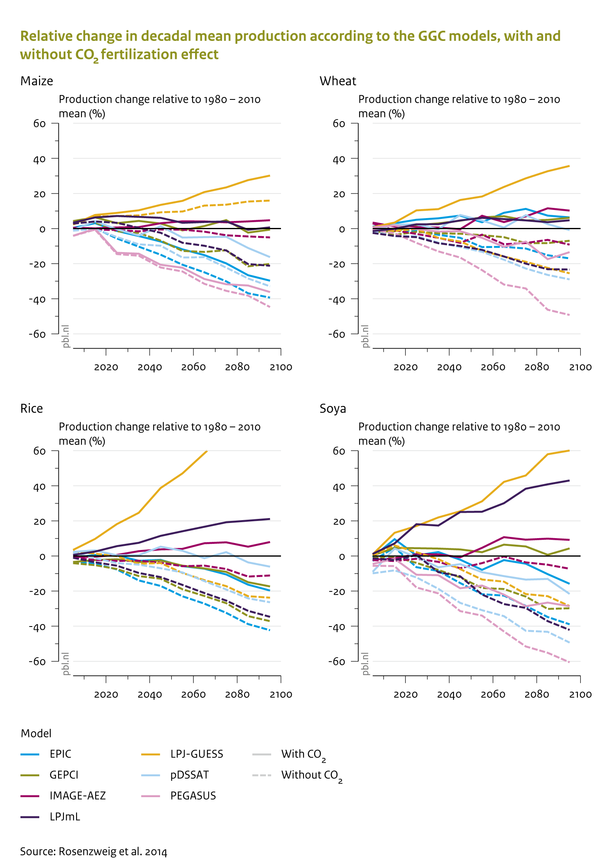
Relative change in decadal mean production according to the GGC models, with and without CO2 fertilization effect

Caption: The effect of climate change on crop yields strongly depends on the effect of CO2 fertilisation, also represented in LPJmL. Lines show means across several climate scenarios; adopted from Rosenzweig et al. (2014).

Figure is used on page(s): Crops and grass

View Image