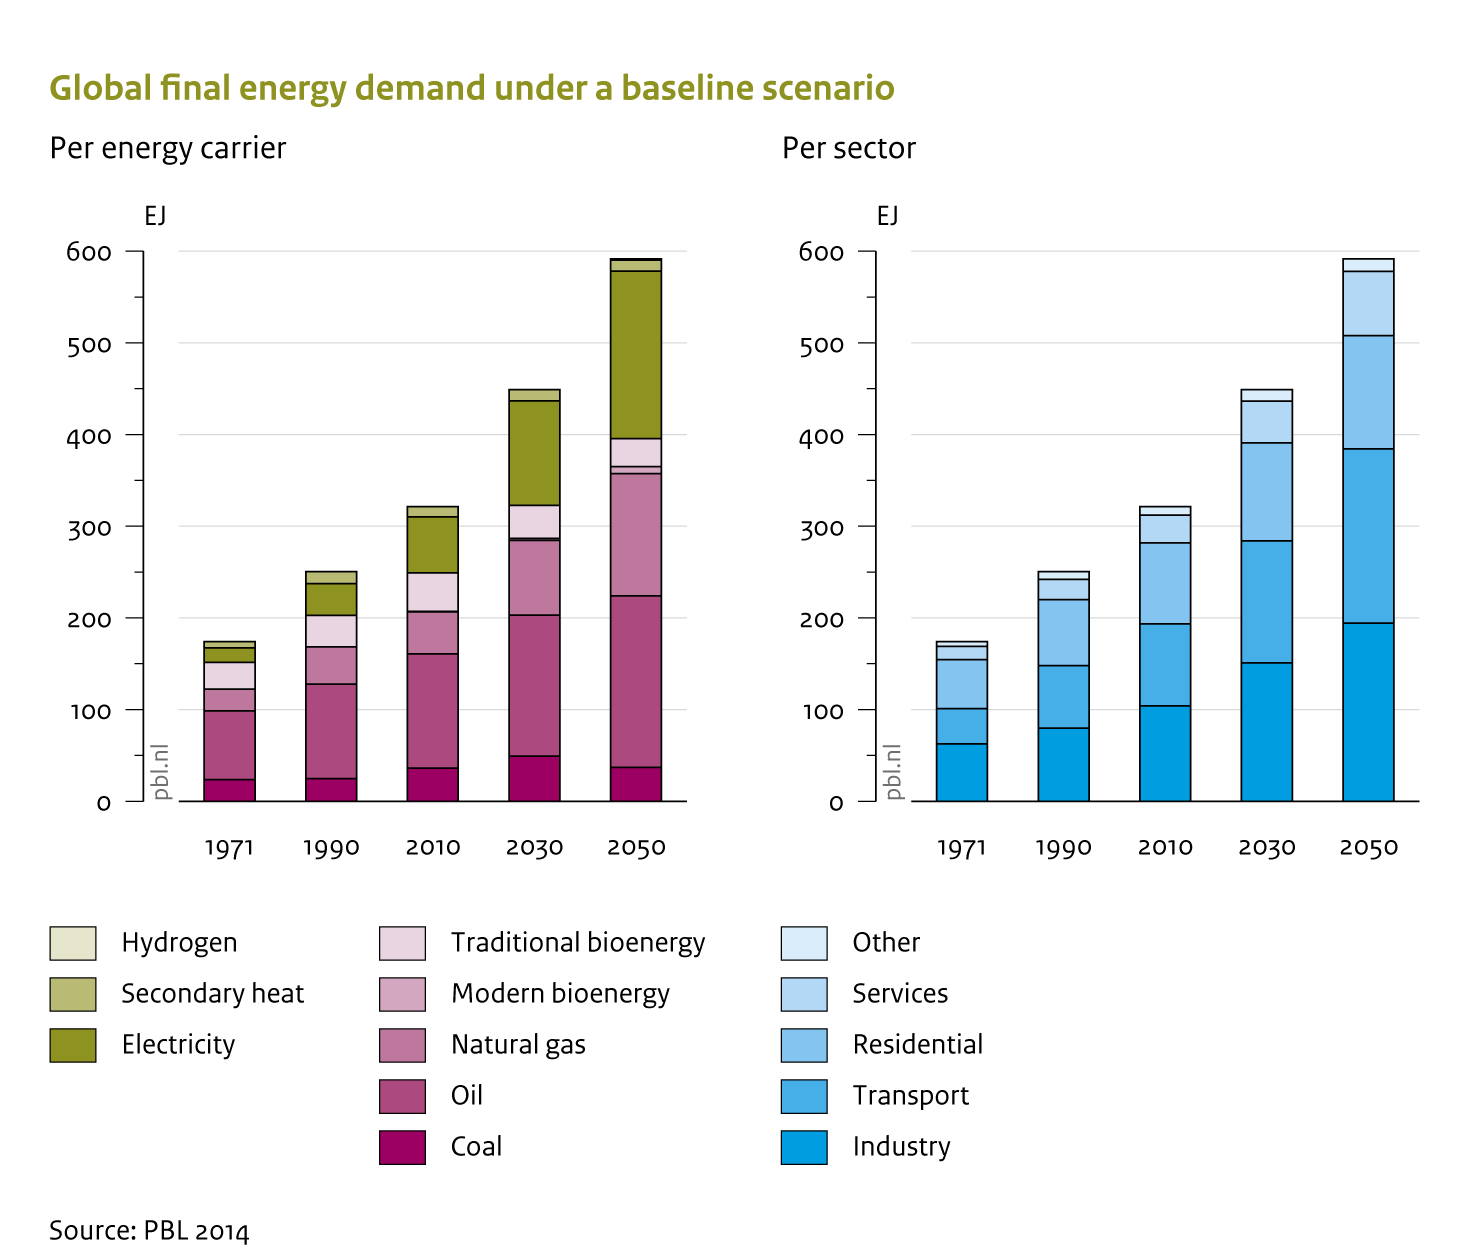
Baseline figure Energy demand
Jump to navigation
Jump to search

Caption: Between 2010 and 2050 energy demand for transport and industry, and for natural gas and electricity contribute most to the overall increase.
Figure is used on page(s): Energy demand