Dataflow overview - pressure components: Difference between revisions
Jump to navigation
Jump to search
Oostenrijr (talk | contribs) No edit summary |
Oostenrijr (talk | contribs) No edit summary |
||
| Line 8: | Line 8: | ||
|? HasInputVar= input | |? HasInputVar= input | ||
|? IsOutputOf= output | |? IsOutputOf= output | ||
| format=graph | | format=graph | ||
| graphname=pressure_components | |||
| graphcolor=yes | | graphcolor=yes | ||
| graphlink=yes | | graphlink=yes | ||
| graphlabel=yes | | graphlabel=yes | ||
| graphsize= | | graphsize=10,10 | ||
| nodeshape=box | | nodeshape=box | ||
| arrowdirection=LR | | arrowdirection=LR | ||
Revision as of 10:47, 19 July 2017
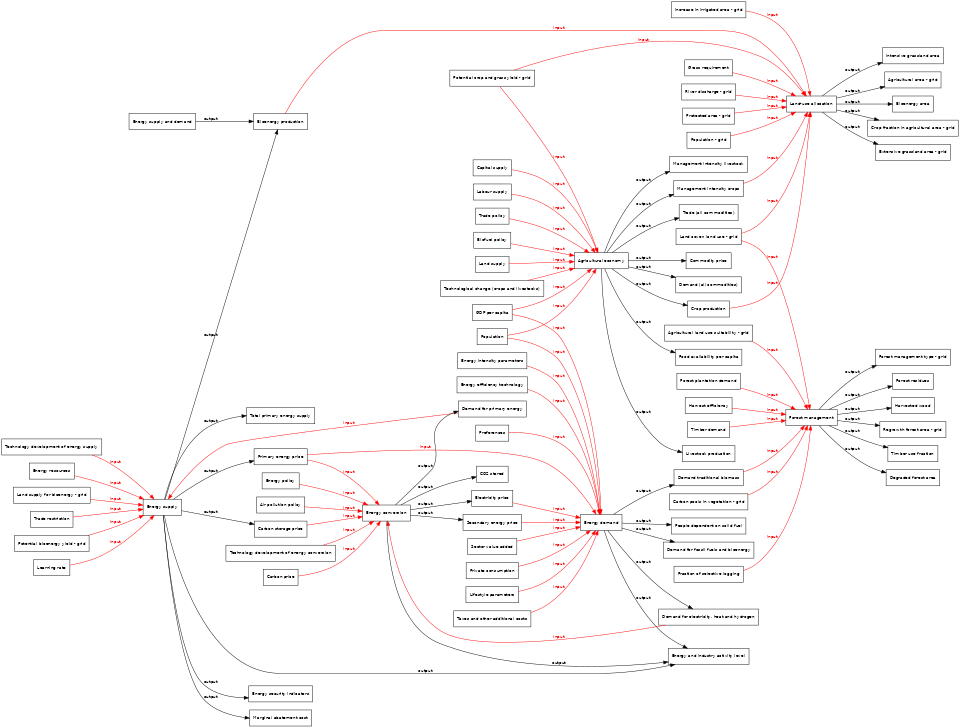
Graphical dataflow overview of pressure components.
Click on a box to navigate to the detailed description.
Related overviews