Special:Badtitle/NS3004:Energy demand - Food processing
Overall layout
Value chain representation
Available value chain elements represented in the IMAGE model:
| Elements | Presence | Elaboration |
| Material extraction | - | - |
| Material demand | x | Logistic growth model plotted to historical per capita consumption data and per capita GDP (Bijl et al., 2006; van Sluisveld et al., 2021) |
| Production routes | x |
Primary (high temperature and low temperature heat) (van Sluisveld al., 2021) |
| Technology choice | x |
Market share decided on multinomial logit formulation, choosing on relative production costs per region (van Sluisveld al., 2021) |
| Trade | - | - |
| End use representation | - | - |
| End-of-life representation | - | - |
Historical representation
Available capital stock present at the start of the simulation:
| Fossil based capacity |
|
Material and energy demand
The IMAGE model includes a dynamic food demand model which is, like the other sectors, driven by the key drivers population and income (see Figure 14). The model is based on Engels law, which states that households with lower incomes generally spend a larger share of their income on food (Engel, 1857). The model represents demand for the same 46 food categories as adopted in the food balance sheets of the FAO (http://www.fao.org/economic/ess/fbs/en/), which link to the functions of food for end-users (energy, protein, flavour, vitamins). Scenarios on dietary change can be modelled by substituting cattle meat by pulses and soy or by reducing expenditures on food in specific households.
Total energy demand for food processing in the IMAGE model is derived from multiplying the total physical production volumes with specific energy consumption values as reported in (Ramirez Ramirez, 2005) and (Wang, 2014). A further breakdown of energy demand across the included production technologies and energy carriers is described in the next section.
Production
The IMAGE model includes a capital stock model for several on-site thermal energy producing technologies in the food processing industry (technology representations based on Große et al. (2017).
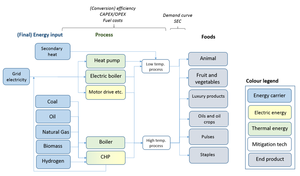
The use of heat generating technologies is differentiated for two specific temperature levels (>100°C and <100°C); see Figure 15. Both represent 50% of the total heat demand (Naegler et al., 2015). CHP hydrogen, secondary heat and the electric heat pump are only available for low temperature heat production. Demand for electric energy is supplied via the power sector representation in IMAGE. Electricity is assumed to be used for both mechanical processing of food products (motor drive, etc.) and cooling.
Dynamic options for systems change
The following capital stock alternatives are at the disposal of the IMAGE model. Options are chosen on a least-cost base. Relative price differences are created through differences and changes in CAPEX, OPEX and policy costs over the time horizon of the model.
| Class | Option |
| Energy innovations |
|
| CC(U)S | |
| Material innovations | |
| Process innovations |
Additional imposable options for systems change
The following options for systems change can be imposed onto the model. Not included in a standard IMAGE model scenario run.
| Class | Option |
| Energy innovations | |
| CC(U)S | |
| Material innovations | |
| Process innovations |

