Special:Badtitle/NS3004:Energy demand - Pulp and paper
Overall layout
Value chain representation
Available value chain elements represented in the IMAGE model:
| Elements | Presence | Elaboration |
| Material extraction | - | - |
| Material demand | x | Logistic growth model plotted to historical per capita consumption data and per capita GDP. A time-dependency factor (representing developments such as digitalization) is included to curtail the growth with rising income. (Roorda et al., 2006; van Sluisveld et al., 2021) |
| Production routes | x |
Primary (mechanical and chemical pulp) and secondary (van Sluisveld al., 2021) |
| Technology choice | x |
Market share decided on multinomial logit formulation, choosing on relative production costs per region (van Sluisveld al., 2021) |
| Trade | - | - |
| End use representation | x | Newsprint, Paper and paperboard, Printing and writing, Other (van Sluisveld et al., 2021) |
| End-of-life representation | x | Fibre recycling, reuse of black liquor (van Sluisveld et al., 2021) |
Historical representation
Available capital stock present at the start of the simulation:
| Fossil based capacity |
|
Material and energy demand
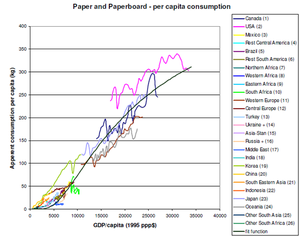
In the IMAGE model, the demand for pulp and paper products is based on a relation in historical consumption per capita data and GDP per capita. A logistic growth curve is fitted on the historical production data on total pulp and paper production as found in FAOSTAT (1971-2003) (see Figure 11). By combining this curve with long-term population and GDP projections, which are exogenous trends to the IMAGE model, it provides an (static) estimate for total pulp and paper production that can be extended into the future. In a subsequent step, various pulp and paper products are distinguished by utilizing fixed shares to derive a representation for e.g. mechanical pulp, chemical pulp and recovered paper, as well as newsprint, writing and printing and other paper and paperboard products. To account for some decoupling of the relation between income and demand for product (Järvinen et al., 2012), the IMAGE model includes a time-dependency factor (representing developments such as digitalisation) to curtail the growth with rising income. The rate of curtailment is an extrapolation of the found decline in product demand per capita during the last decade for each paper product (2000-2015), distinguishing between OECD and non-OECD developments. The demand of WISEE is based on IMAGE.
Total energy demand for pulp and paper production in the IMAGE model is derived by multiplying the estimated physical production volumes with specific energy consumption values and time-dependent efficiency improvement factors as reported in VLEEM (2005). A further breakdown of energy demand across the included production technologies and energy carriers is described in the next section.
Production
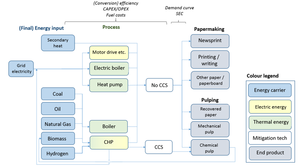
The IMAGE model includes a simple representation of the pulp and paper industry (Figure 12). The model is focused on common processes in both the pulping and paper making process. As the drying and dewatering processes are the most energy-intensive processes in both the pulping and papermaking industries (GL, 2015c), thermal energy demand is considered the most important aspect of the model. Market pulp is considered the only intermediate product (implying that pulp production happens separately from paper). Furthermore, secondary fibres (repulping processes) are integrated in paper production and processes are assumed to be fully on-line (continuous). All chemical pulping is considered to be following the Kraft method. The Kraft process recovers biomass residues (black liquor) via the chemical extraction of lignin from woody material, which is used as a (bio)fuel in the recovery boiler.
The IMAGE model includes a capital stock model for the on-site thermal energy producing technologies in the pulp and papermaking industry. Various options for thermal energy supply are included (Table 4). It is assumed that 25% of the energy demand can be provided by low-heat technologies, based on Naegler et al. (2015) . Thermal energy is considered to be solely destined for (conventional) drying processes, such as contact and steam drying techniques. Electricity is assumed to be used for both mechanical processing of pulp and paper (motor drive, etc.) and (innovative) dewatering and drying techniques. The IMAGE model contains an electricity sector representation that simulates investments and production of electricity for the different end-use sectors. Some of the thermal production options also produce electricity (combined heat and power technologies). This electricity is assumed to be consumed in the sector itself and is therefore not included in the net electricity consumption of the sector.
Dynamic options for systems change
The following capital stock alternatives are at the disposal of the IMAGE model. Options are chosen on a least-cost base. Relative price differences are created through differences and changes in CAPEX, OPEX and policy costs over the time horizon of the model.
| Class | Option |
| Energy innovations |
|
| CC(U)S |
|
| Material innovations | |
| Process innovations |
|
Additional imposable options for systems change
The following options for systems change can be imposed onto the model. Not included in a standard IMAGE model scenario run.
| Class | Option |
| Energy innovations | |
| CC(U)S | |
| Material innovations |
|
| Process innovations |
|

