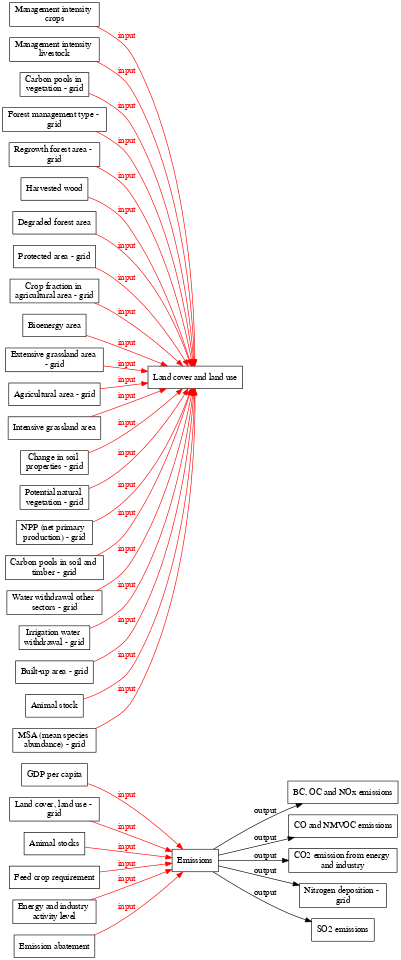
File:Dataflow overview interaction components digraph interaction components dot.png
Jump to navigation
Jump to search
Size of this preview: 250 × 599 pixels. Other resolution: 401 × 960 pixels.
Original file (401 × 960 pixels, file size: 81 KB, MIME type: image/png)
ImageMap
When including this image in a wiki page, use the following mark-up to enable links:
<imagemap>
File:Dataflow_overview___interaction_components_digraph_interaction_components_dot.png
rect 643 408 780 436 [[BC  OC and NOx emissions]]
rect 527 517 585 545 [[Emissions]]
rect 644 451 780 479 [[CO and NMVOC emissions]]
rect 644 494 779 524 [[CO2 emission from energy and industry]]
rect 657 538 766 568 [[Nitrogen deposition - grid]]
rect 646 583 777 625 [[Non-CO2 GHG emissions (CH4  N2O and Halocarbons)]]
rect 673 640 751 669 [[SO2 emissions]]
rect 381 338 457 367 [[Animal stocks]]
rect 368 381 470 410 [[Emission abatement]]
rect 362 424 476 455 [[Land cover  land use - grid]]
rect 367 556 471 587 [[Energy and industry activity level]]
rect 363 601 474 630 [[Feed crop requirement]]
rect 379 644 459 673 [[GDP per capita]]
rect 185 469 304 498 [[Land cover and land use]]
rect 385 469 452 498 [[Land supply]]
rect 376 512 461 542 [[Land supply for bioenergy - grid]]
rect 25 3 112 33 [[Potential natural vegetation - grid]]
rect 13 48 124 78 [[Crop fraction in agricultural area - grid]]
rect 29 92 108 121 [[Bioenergy area]]
rect 7 135 130 166 [[Extensive grassland area - grid]]
rect 10 180 127 209 [[Intensive grassland area]]
rect 12 223 125 253 [[Management intensity crops]]
rect 12 267 125 298 [[Management intensity livestock]]
rect 24 312 113 342 [[Irrigation water withdrawal - grid]]
rect 9 357 128 387 [[Water withdrawal other sectors - grid]]
rect 3 401 134 431 [[Forest management type - grid]]
rect 27 446 110 476 [[Change in soil properties - grid]]
rect 7 490 130 521 [[Carbon pools in soil and timber - grid]]
rect 26 535 111 565 [[Carbon pools in vegetation - grid]]
rect 22 580 115 610 [[NPP (net primary production) - grid]]
rect 16 624 121 654 [[MSA (mean species abundance) - grid]]
rect 12 669 125 699 [[Regrowth forest area - grid]]
rect 12 713 125 742 [[Agricultural area - grid]]
rect 18 756 119 785 [[Protected area - grid]]
rect 17 799 120 828 [[Degraded forest area]]
rect 27 842 110 871 [[Harvested wood]]
rect 33 885 104 914 [[Animal stock]]
rect 20 928 117 957 [[Built-up area - grid]]</imagemap>
See ImageMap for more information.
File history
Click on a date/time to view the file as it appeared at that time.
| Date/Time | Thumbnail | Dimensions | User | Comment | |
|---|---|---|---|---|---|
| current | 11:08, 23 March 2020 | | 401 × 960 (81 KB) | Oostenrijr (talk | contribs) | |
| 14:47, 12 March 2020 |  | 793 × 960 (120 KB) | Oostenrijr (talk | contribs) | ||
| 14:58, 10 March 2020 |  | 793 × 960 (121 KB) | Oostenrijr (talk | contribs) | ||
| 10:46, 19 July 2017 | 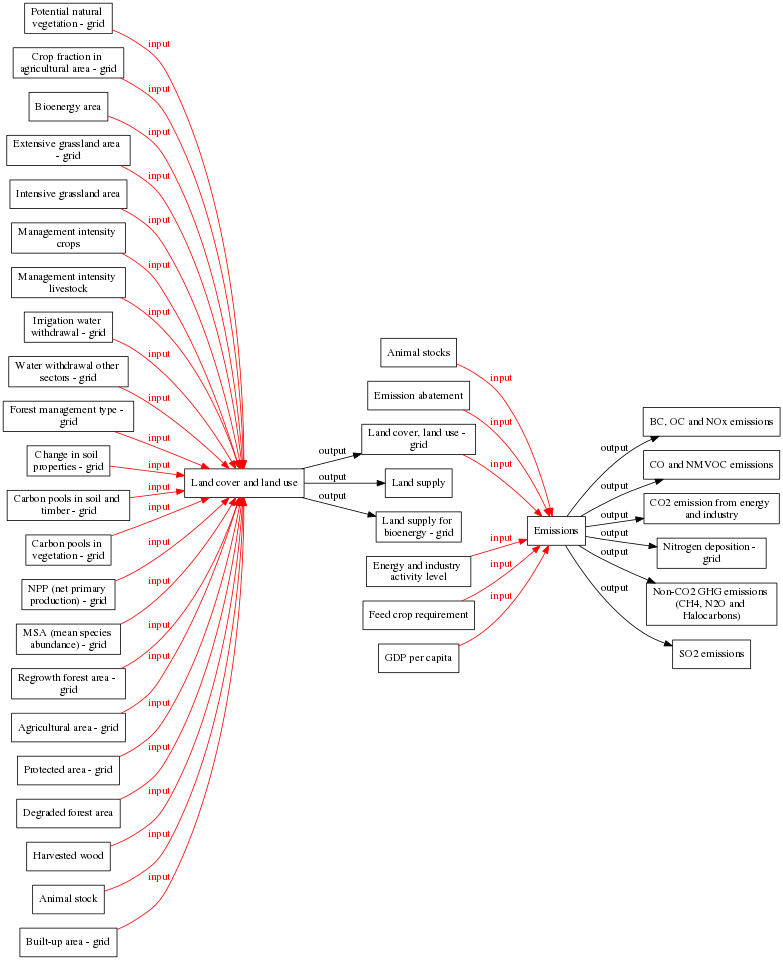 | 783 × 960 (117 KB) | Oostenrijr (talk | contribs) | generated by the GraphViz extension from the Dataflow overview - interaction components page | |
| 10:39, 19 July 2017 |  | 1,312 × 1,608 (236 KB) | Oostenrijr (talk | contribs) | generated by the GraphViz extension from the Dataflow overview - interaction components page | |
| 10:35, 19 July 2017 |  | 1,312 × 1,608 (236 KB) | Oostenrijr (talk | contribs) | generated by the GraphViz extension from the Dataflow overview - interaction components page |
You cannot overwrite this file.
File usage
The following page uses this file: