File:Dataflow overview pressure components digraph pressure components dot.png: Difference between revisions
Jump to navigation
Jump to search
Oostenrijr (talk | contribs) (generated by the GraphViz extension from the Dataflow overview - pressure components page) |
Oostenrijr (talk | contribs) (Oostenrijr uploaded a new version of File:Dataflow overview pressure components digraph pressure components dot.png) |
(No difference)
| |
Revision as of 10:49, 19 July 2017
ImageMap
When including this image in a wiki page, use the following mark-up to enable links:
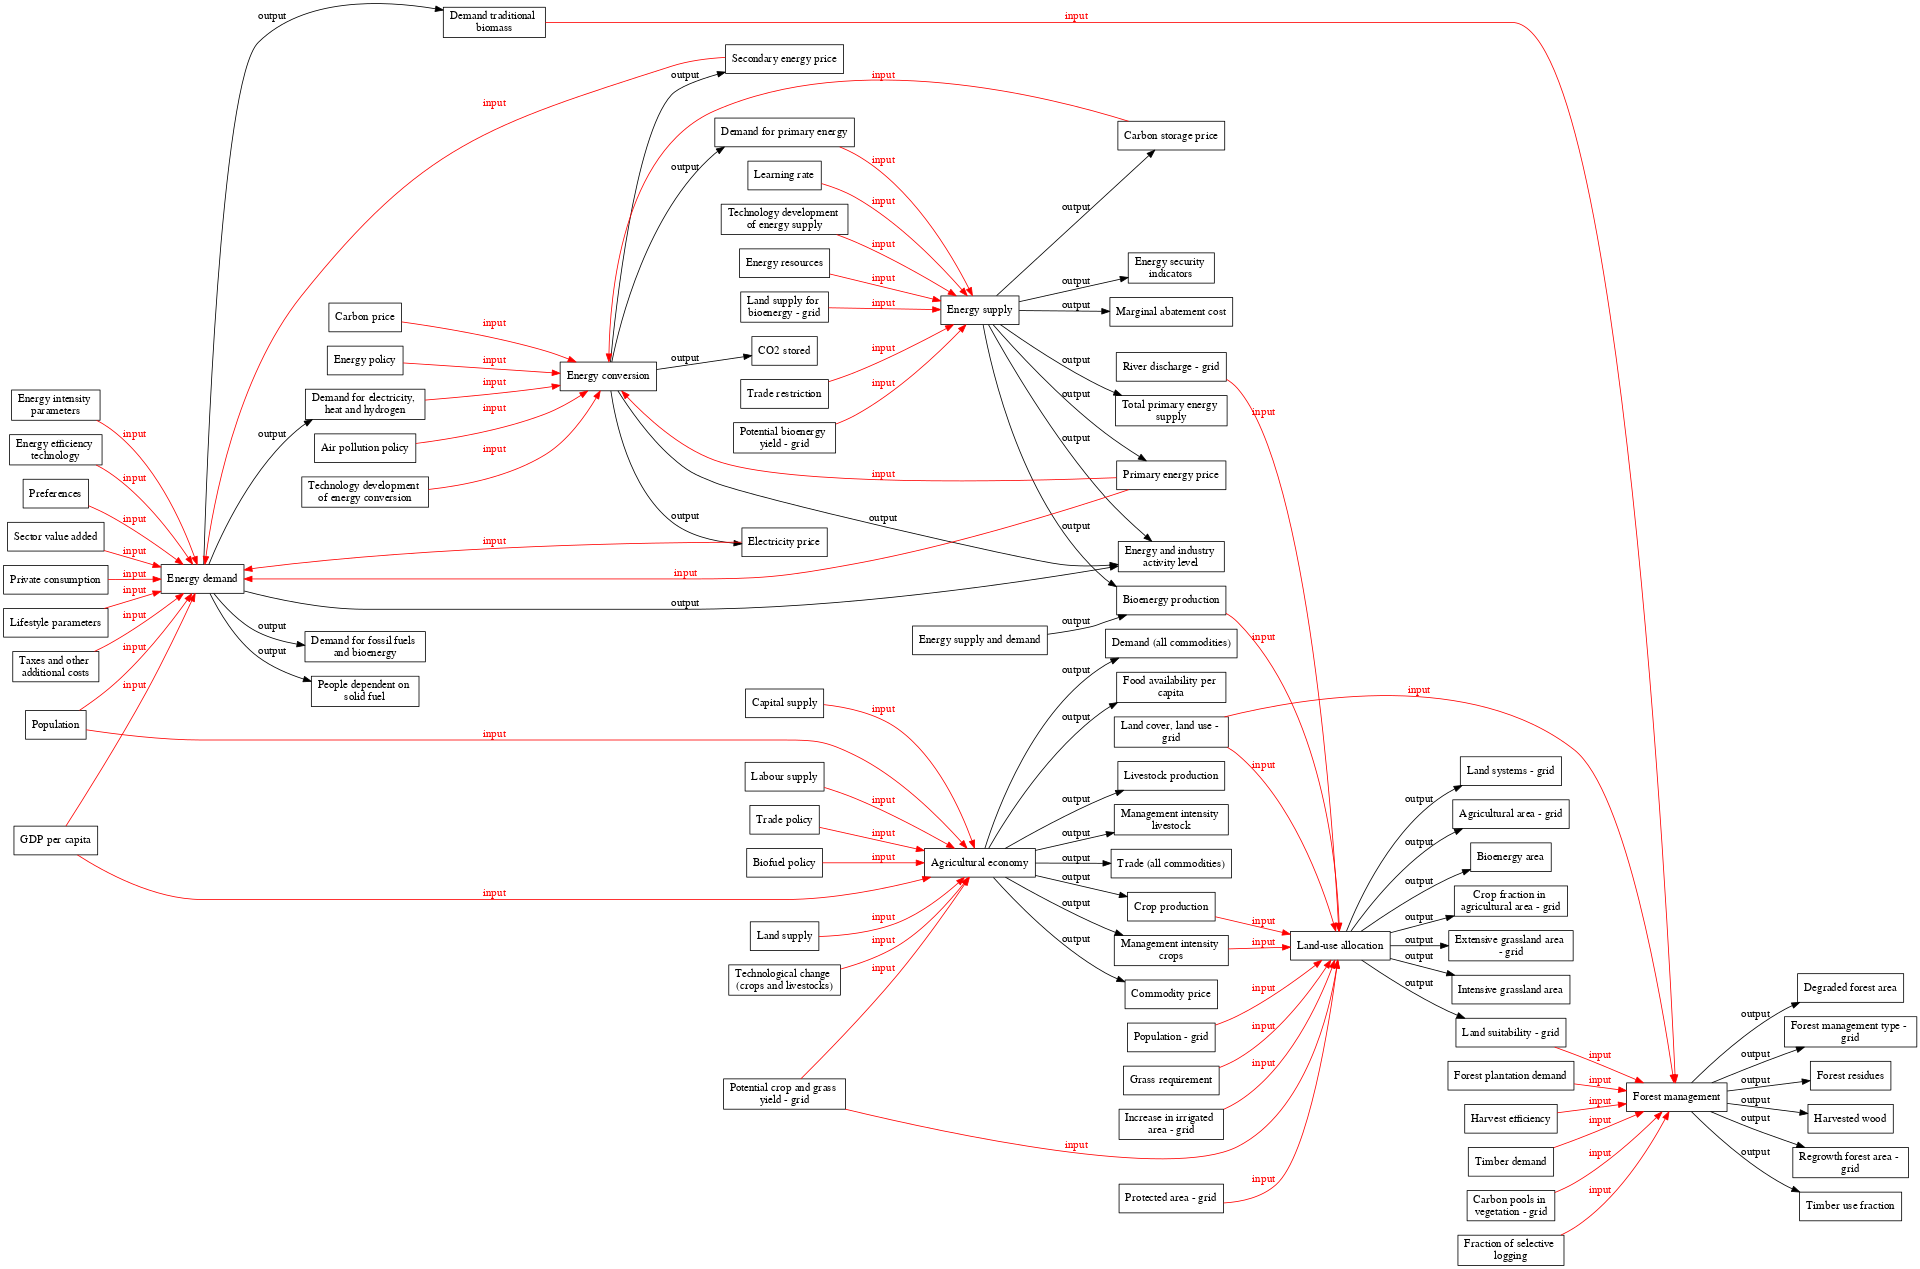
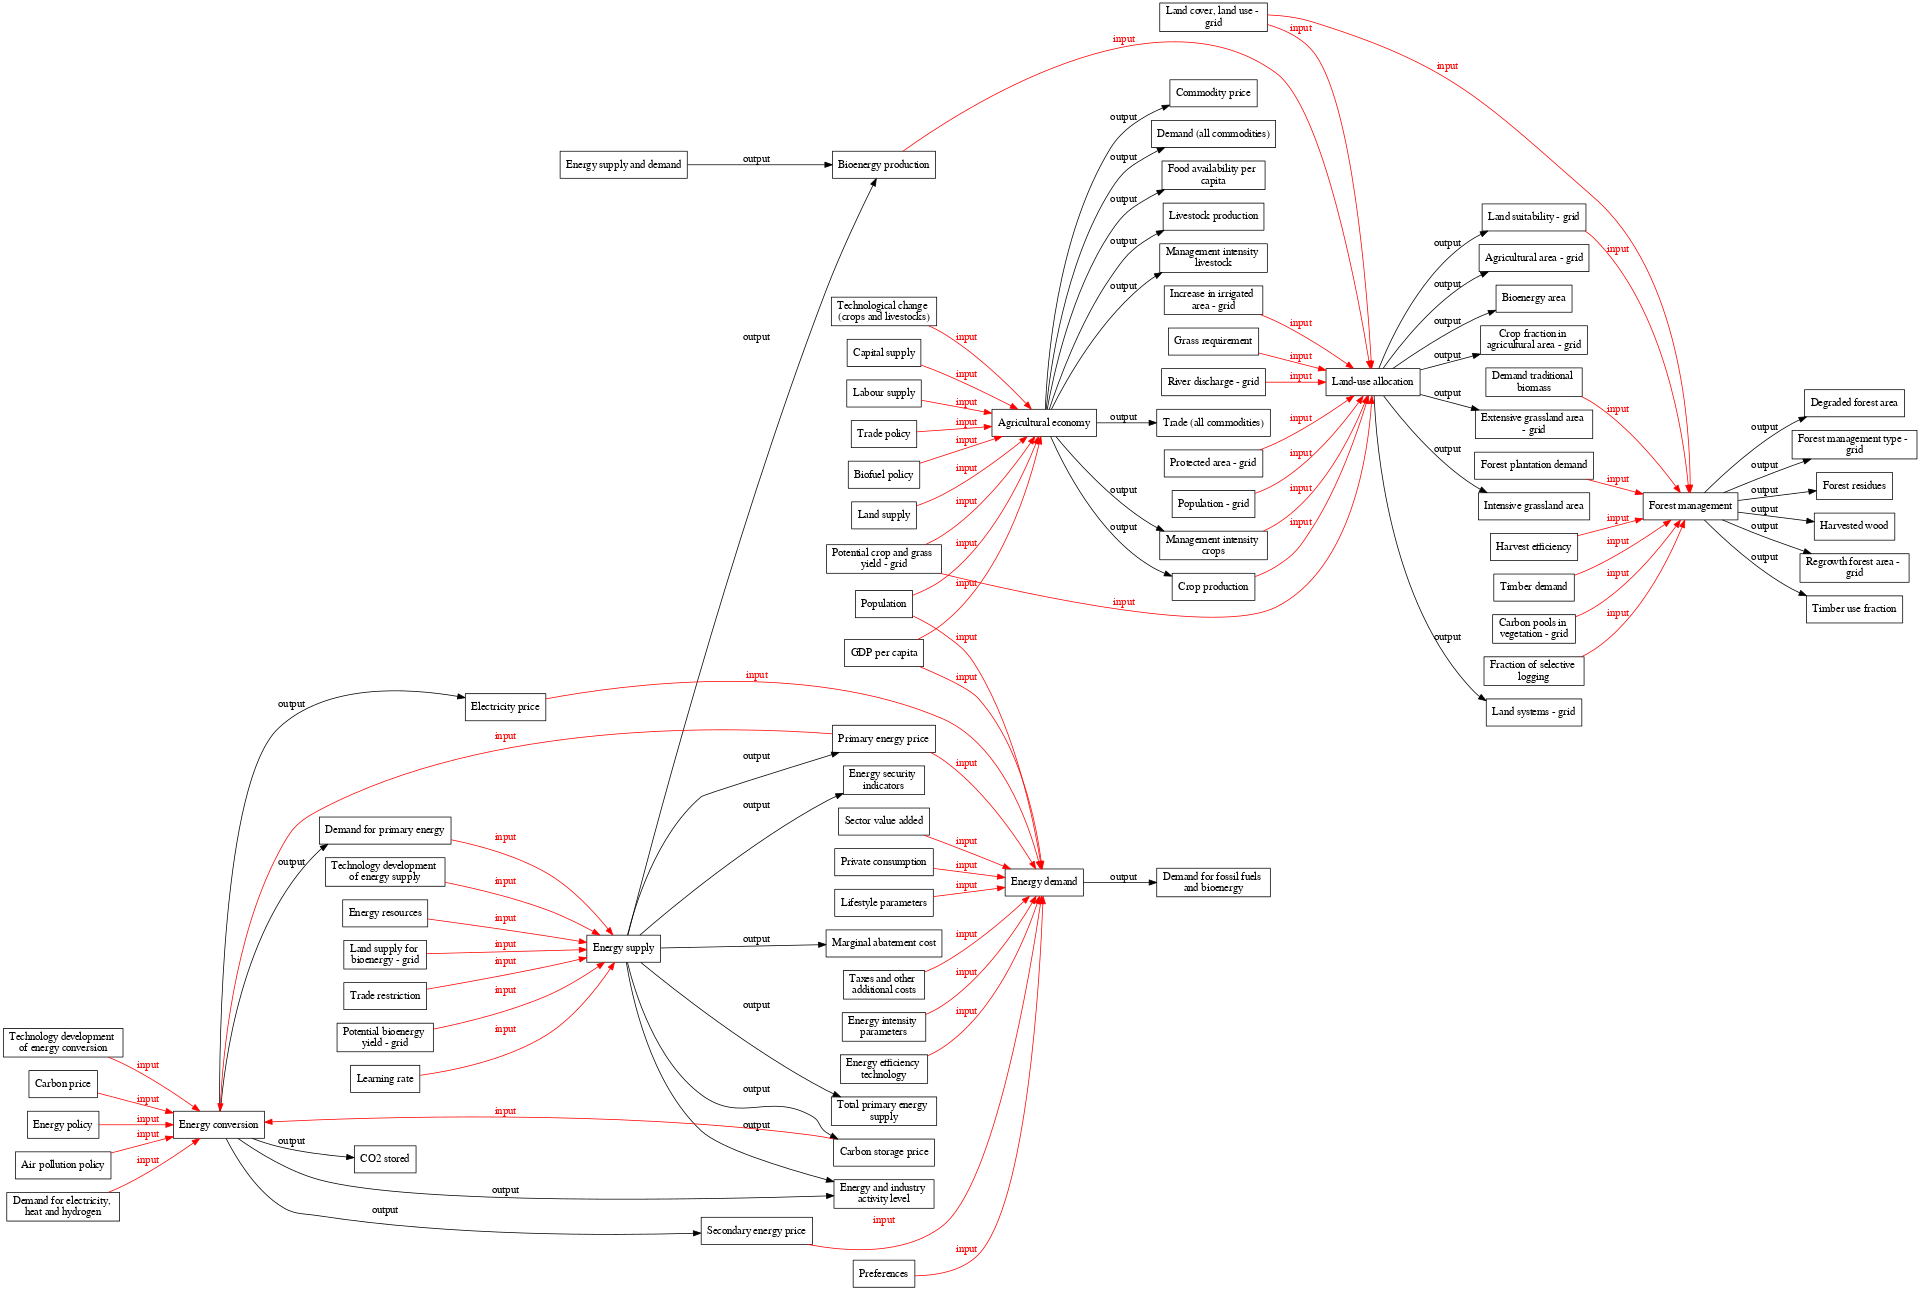
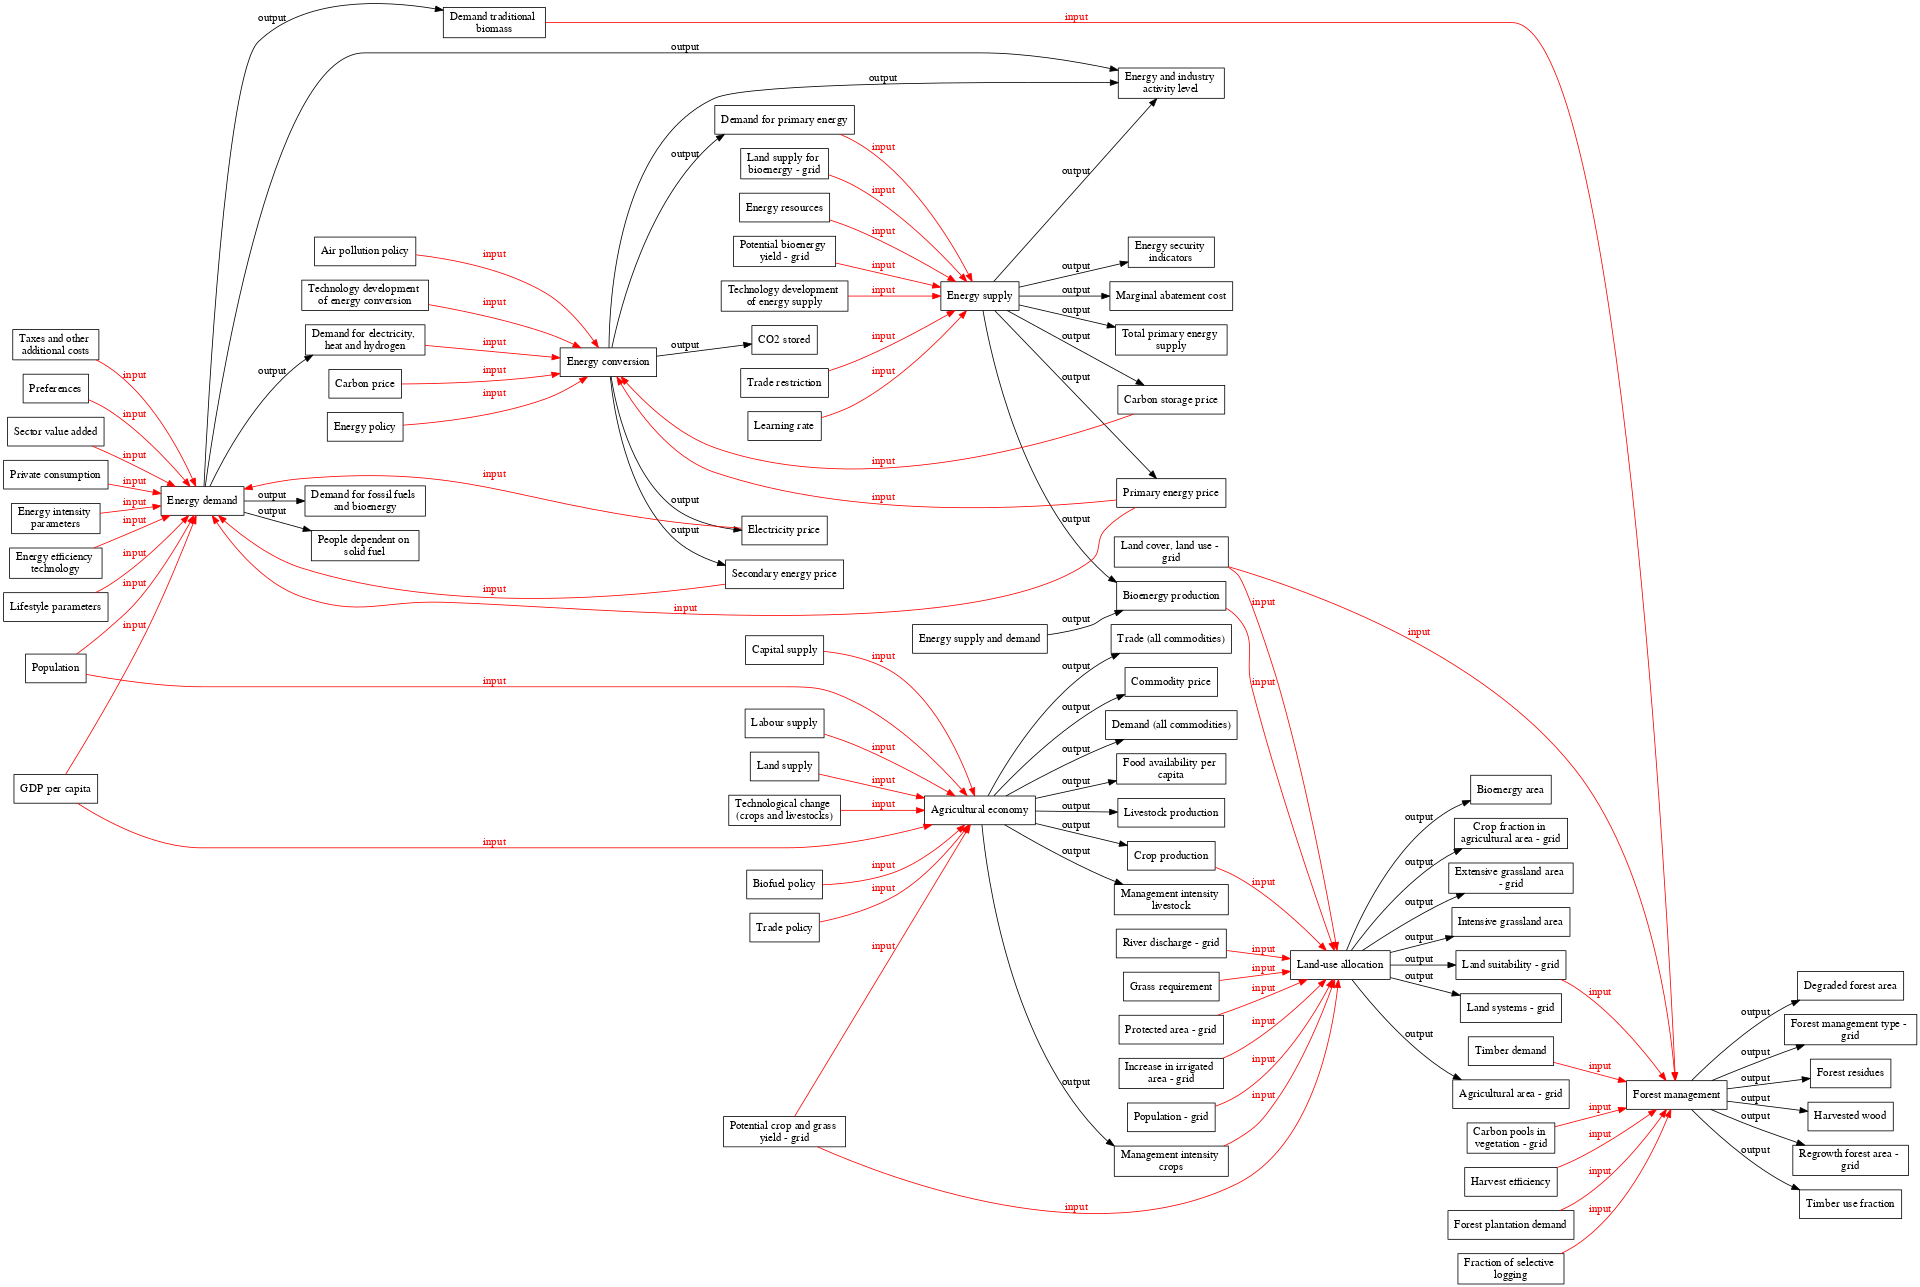
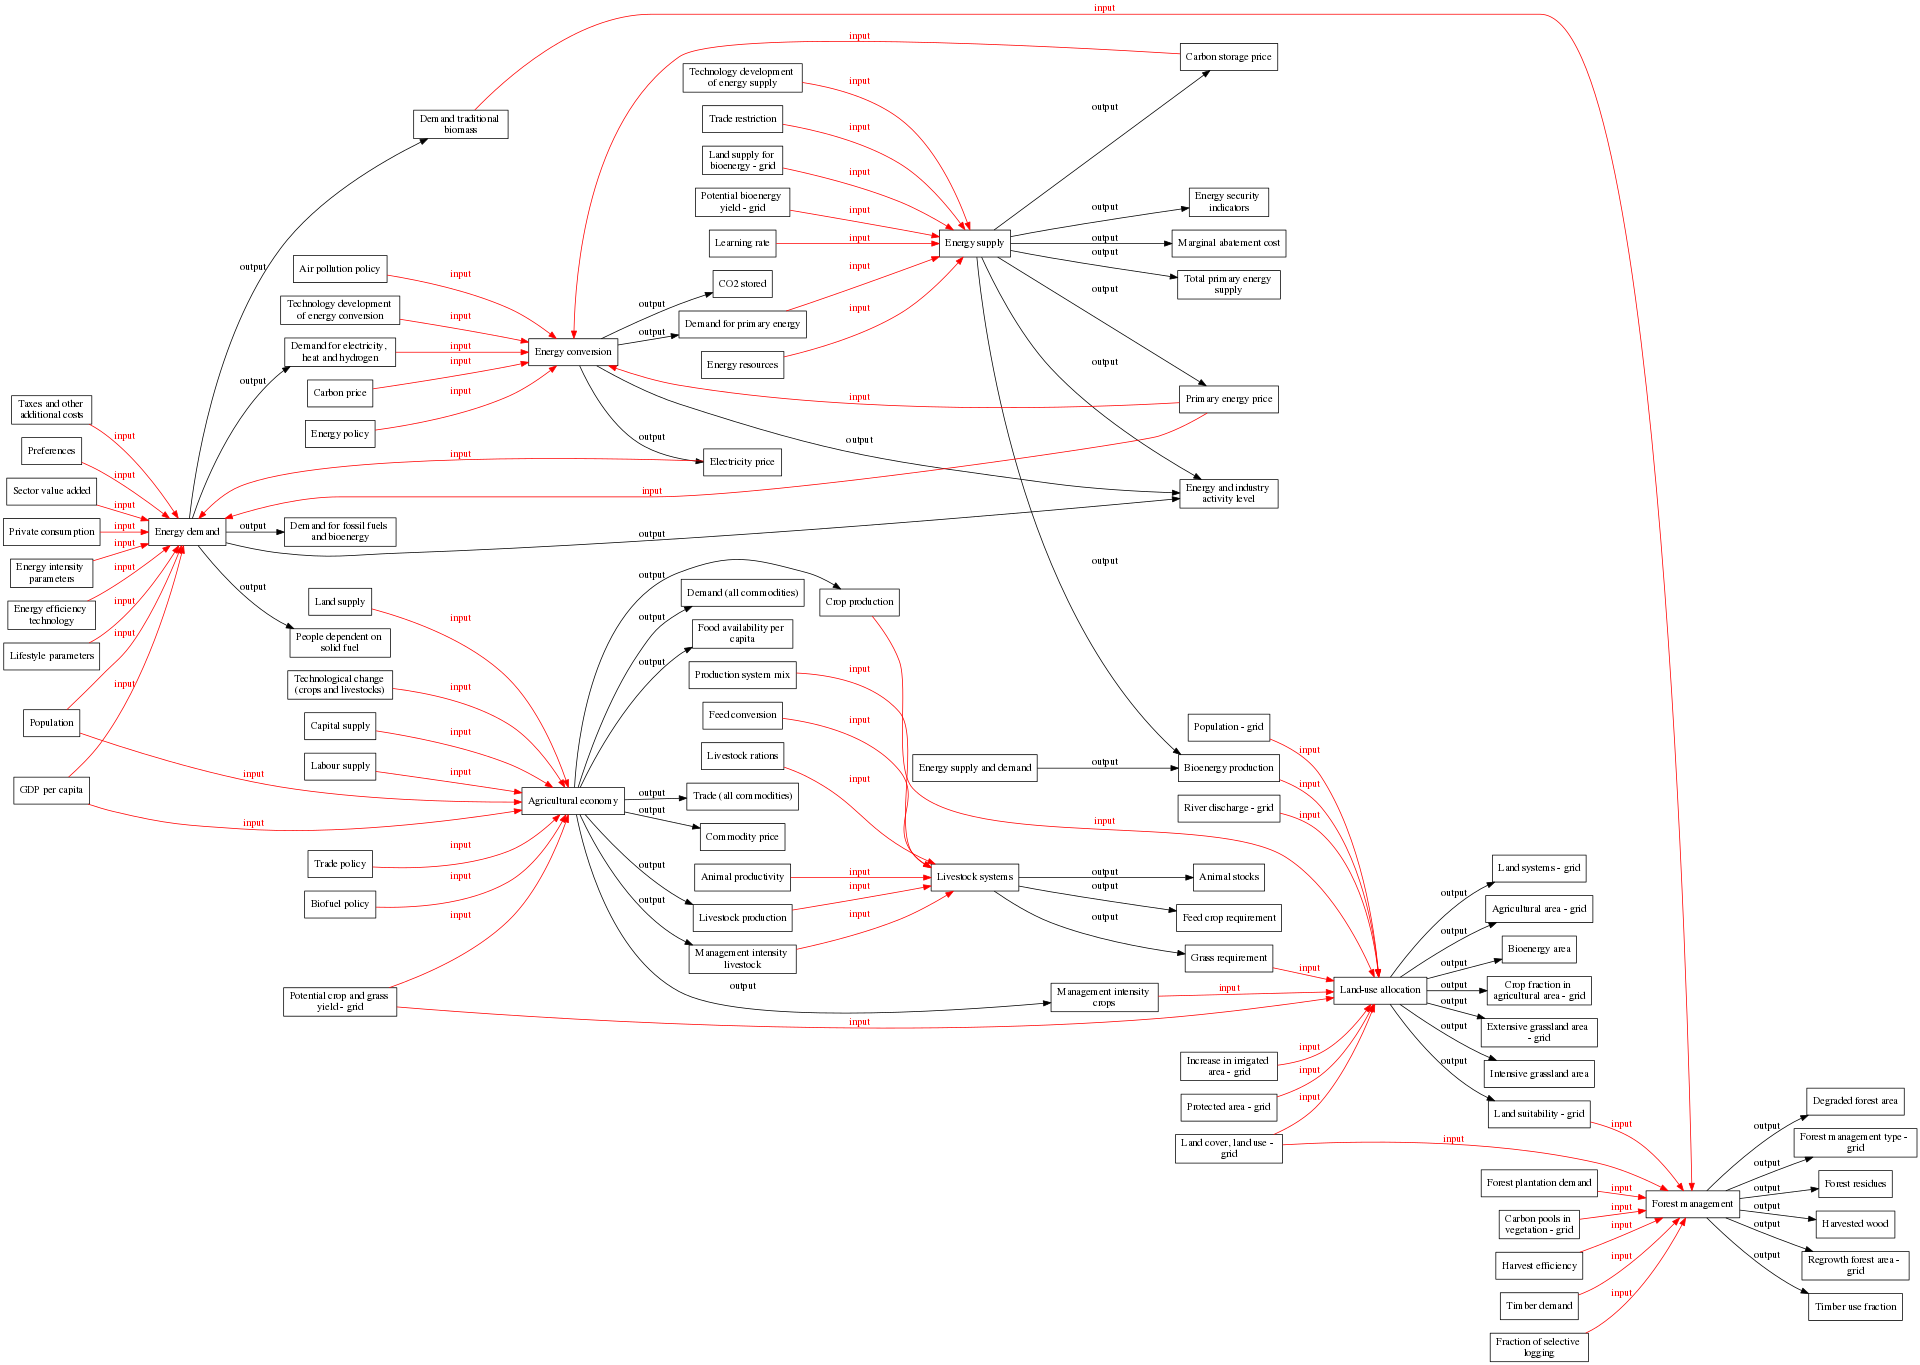
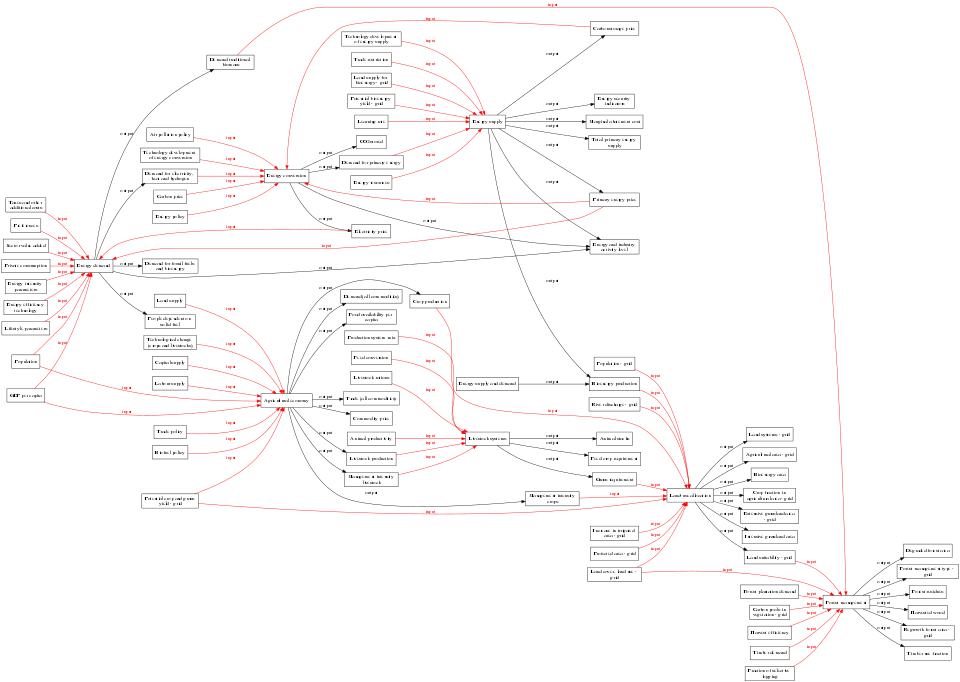
<imagemap>
File:Dataflow_overview___pressure_components_digraph_pressure_components_dot.png
rect 1114 672 1195 692 [[Agricultural area - grid]]
rect 1000 733 1070 753 [[Land-use allocation]]
rect 1127 702 1182 722 [[Bioenergy area]]
rect 1115 732 1194 754 [[Crop fraction in agricultural area - grid]]
rect 1111 764 1198 785 [[Extensive grassland area - grid]]
rect 1113 795 1196 816 [[Intensive grassland area]]
rect 1116 826 1193 846 [[Land suitability - grid]]
rect 1119 641 1190 662 [[Land systems - grid]]
rect 391 591 468 611 [[Agricultural economy]]
rect 525 618 589 638 [[Commodity price]]
rect 615 442 674 462 [[Crop production]]
rect 511 434 603 455 [[Demand (all commodities)]]
rect 519 465 595 486 [[Food availability per capita]]
rect 520 678 594 699 [[Livestock production]]
rect 788 737 869 759 [[Management intensity crops]]
rect 517 709 597 730 [[Management intensity livestock]]
rect 515 587 599 608 [[Trade (all commodities)]]
rect 18 532 60 553 [[Population]]
rect 112 389 169 409 [[Energy demand]]
rect 10 583 67 603 [[GDP per capita]]
rect 228 535 282 555 [[Capital supply]]
rect 228 565 282 585 [[Labour supply]]
rect 231 638 279 658 [[Trade policy]]
rect 228 668 282 689 [[Biofuel policy]]
rect 232 441 279 461 [[Land supply]]
rect 213 741 298 762 [[Potential crop and grass yield - grid]]
rect 216 503 295 524 [[Technological change (crops and livestocks)]]
rect 895 648 948 668 [[Animal stocks]]
rect 698 648 764 668 [[Livestock systems]]
rect 882 678 961 699 [[Feed crop requirement]]
rect 889 709 955 729 [[Grass requirement]]
rect 884 566 960 586 [[Bioenergy production]]
rect 705 173 758 193 [[Energy supply]]
rect 885 33 958 53 [[Carbon storage price]]
rect 885 360 959 381 [[Energy and industry activity level]]
rect 892 141 952 162 [[Energy security indicators]]
rect 879 173 964 193 [[Marginal abatement cost]]
rect 885 289 959 310 [[Primary energy price]]
rect 883 203 960 224 [[Total primary energy supply]]
rect 685 566 778 586 [[Energy supply and demand]]
rect 535 203 579 223 [[CO2 stored]]
rect 397 254 463 274 [[Energy conversion]]
rect 509 233 605 253 [[Demand for primary energy]]
rect 528 337 586 357 [[Electricity price]]
rect 1355 816 1428 836 [[Degraded forest area]]
rect 1235 893 1305 913 [[Forest management]]
rect 1346 846 1438 868 [[Forest management type - grid]]
rect 1364 878 1419 898 [[Forest residues]]
rect 1362 908 1421 929 [[Harvested wood]]
rect 1351 939 1432 960 [[Regrowth forest area - grid]]
rect 1357 970 1427 990 [[Timber use fraction]]
rect 214 253 297 275 [[Demand for electricity  heat and hydrogen]]
rect 213 388 297 410 [[Demand for fossil fuels and bioenergy]]
rect 310 83 381 104 [[Demand traditional biomass]]
rect 218 472 293 493 [[People dependent on solid fuel]]
rect 231 285 280 305 [[Carbon price]]
rect 229 315 281 336 [[Energy policy]]
rect 220 192 290 212 [[Air pollution policy]]
rect 210 222 300 243 [[Technology development of energy conversion]]
rect 5 359 73 379 [[Sector value added]]
rect 3 389 75 409 [[Private consumption]]
rect 8 419 70 441 [[Energy intensity parameters]]
rect 6 451 72 472 [[Energy efficiency technology]]
rect 3 482 75 502 [[Lifestyle parameters]]
rect 9 297 69 318 [[Taxes and other additional costs]]
rect 16 328 61 348 [[Preferences]]
rect 526 264 588 284 [[Energy resources]]
rect 512 48 602 69 [[Technology development of energy supply]]
rect 527 79 587 99 [[Trade restriction]]
rect 527 110 587 131 [[Land supply for bioenergy - grid]]
rect 522 141 592 162 [[Potential bioenergy yield - grid]]
rect 532 173 582 193 [[Learning rate]]
rect 882 851 962 872 [[Land cover  land use - grid]]
rect 1111 877 1198 898 [[Forest plantation demand]]
rect 1124 908 1185 929 [[Carbon pools in vegetation - grid]]
rect 1122 939 1187 959 [[Harvest efficiency]]
rect 1125 970 1184 990 [[Timber demand]]
rect 1118 1000 1191 1021 [[Fraction of selective logging]]
rect 886 789 958 810 [[Increase in irrigated area - grid]]
rect 886 821 958 841 [[Protected area - grid]]
rect 891 536 952 556 [[Population - grid]]
rect 884 596 960 617 [[River discharge - grid]]
rect 517 496 597 517 [[Production system mix]]
rect 527 527 587 547 [[Feed conversion]]
rect 526 557 588 577 [[Livestock rations]]
rect 521 648 593 668 [[Animal productivity]]</imagemap>
See ImageMap for more information.
File history
Click on a date/time to view the file as it appeared at that time.


You cannot overwrite this file.
File usage
The following page uses this file: