File:Dataflow overview pressure components digraph pressure components dot.png
Jump to navigation
Jump to search
Size of this preview: 800 × 529 pixels. Other resolution: 1,920 × 1,269 pixels.
Original file (1,920 × 1,269 pixels, file size: 307 KB, MIME type: image/png)
ImageMap
When including this image in a wiki page, use the following mark-up to enable links:
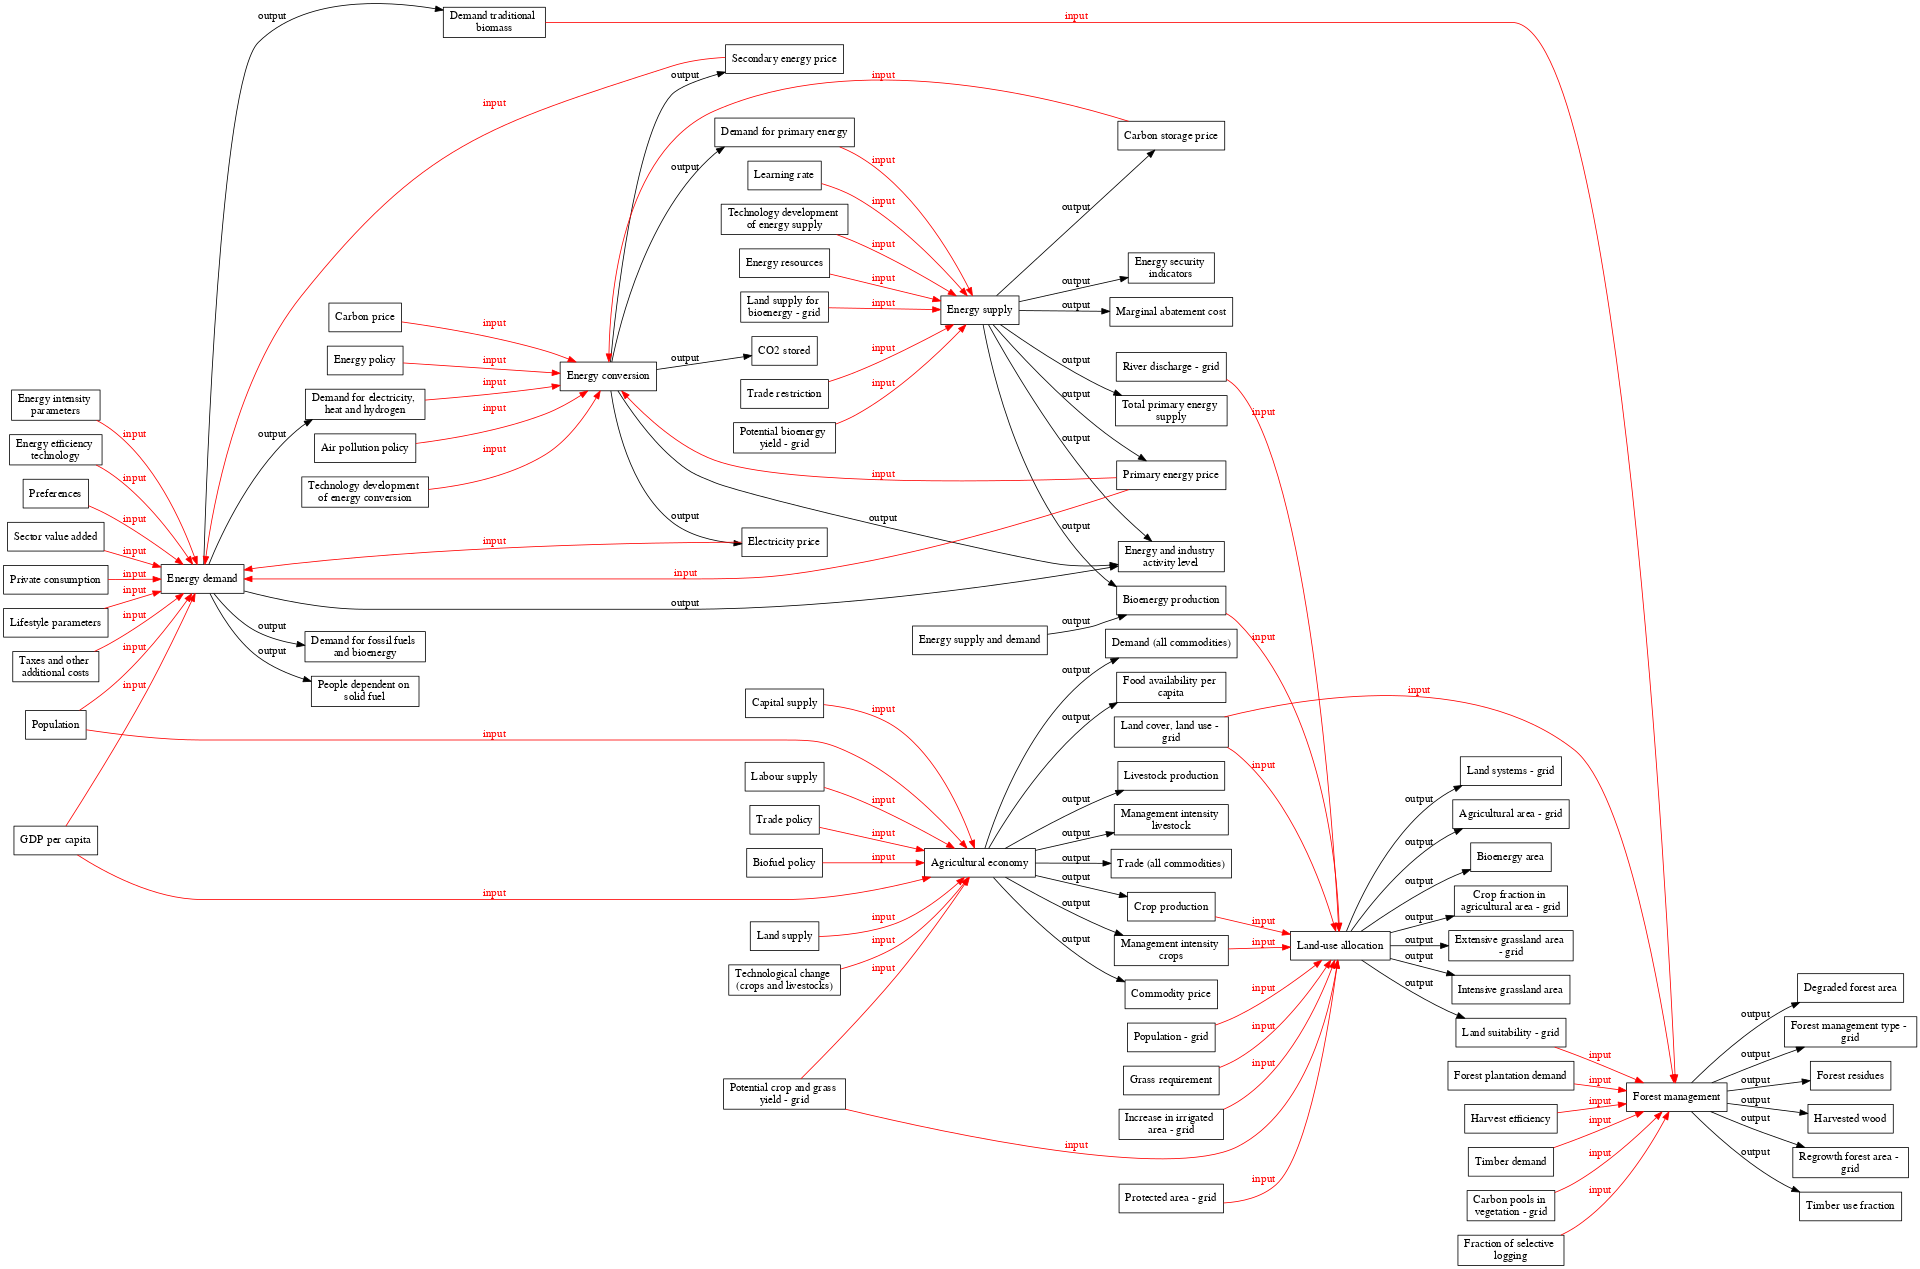
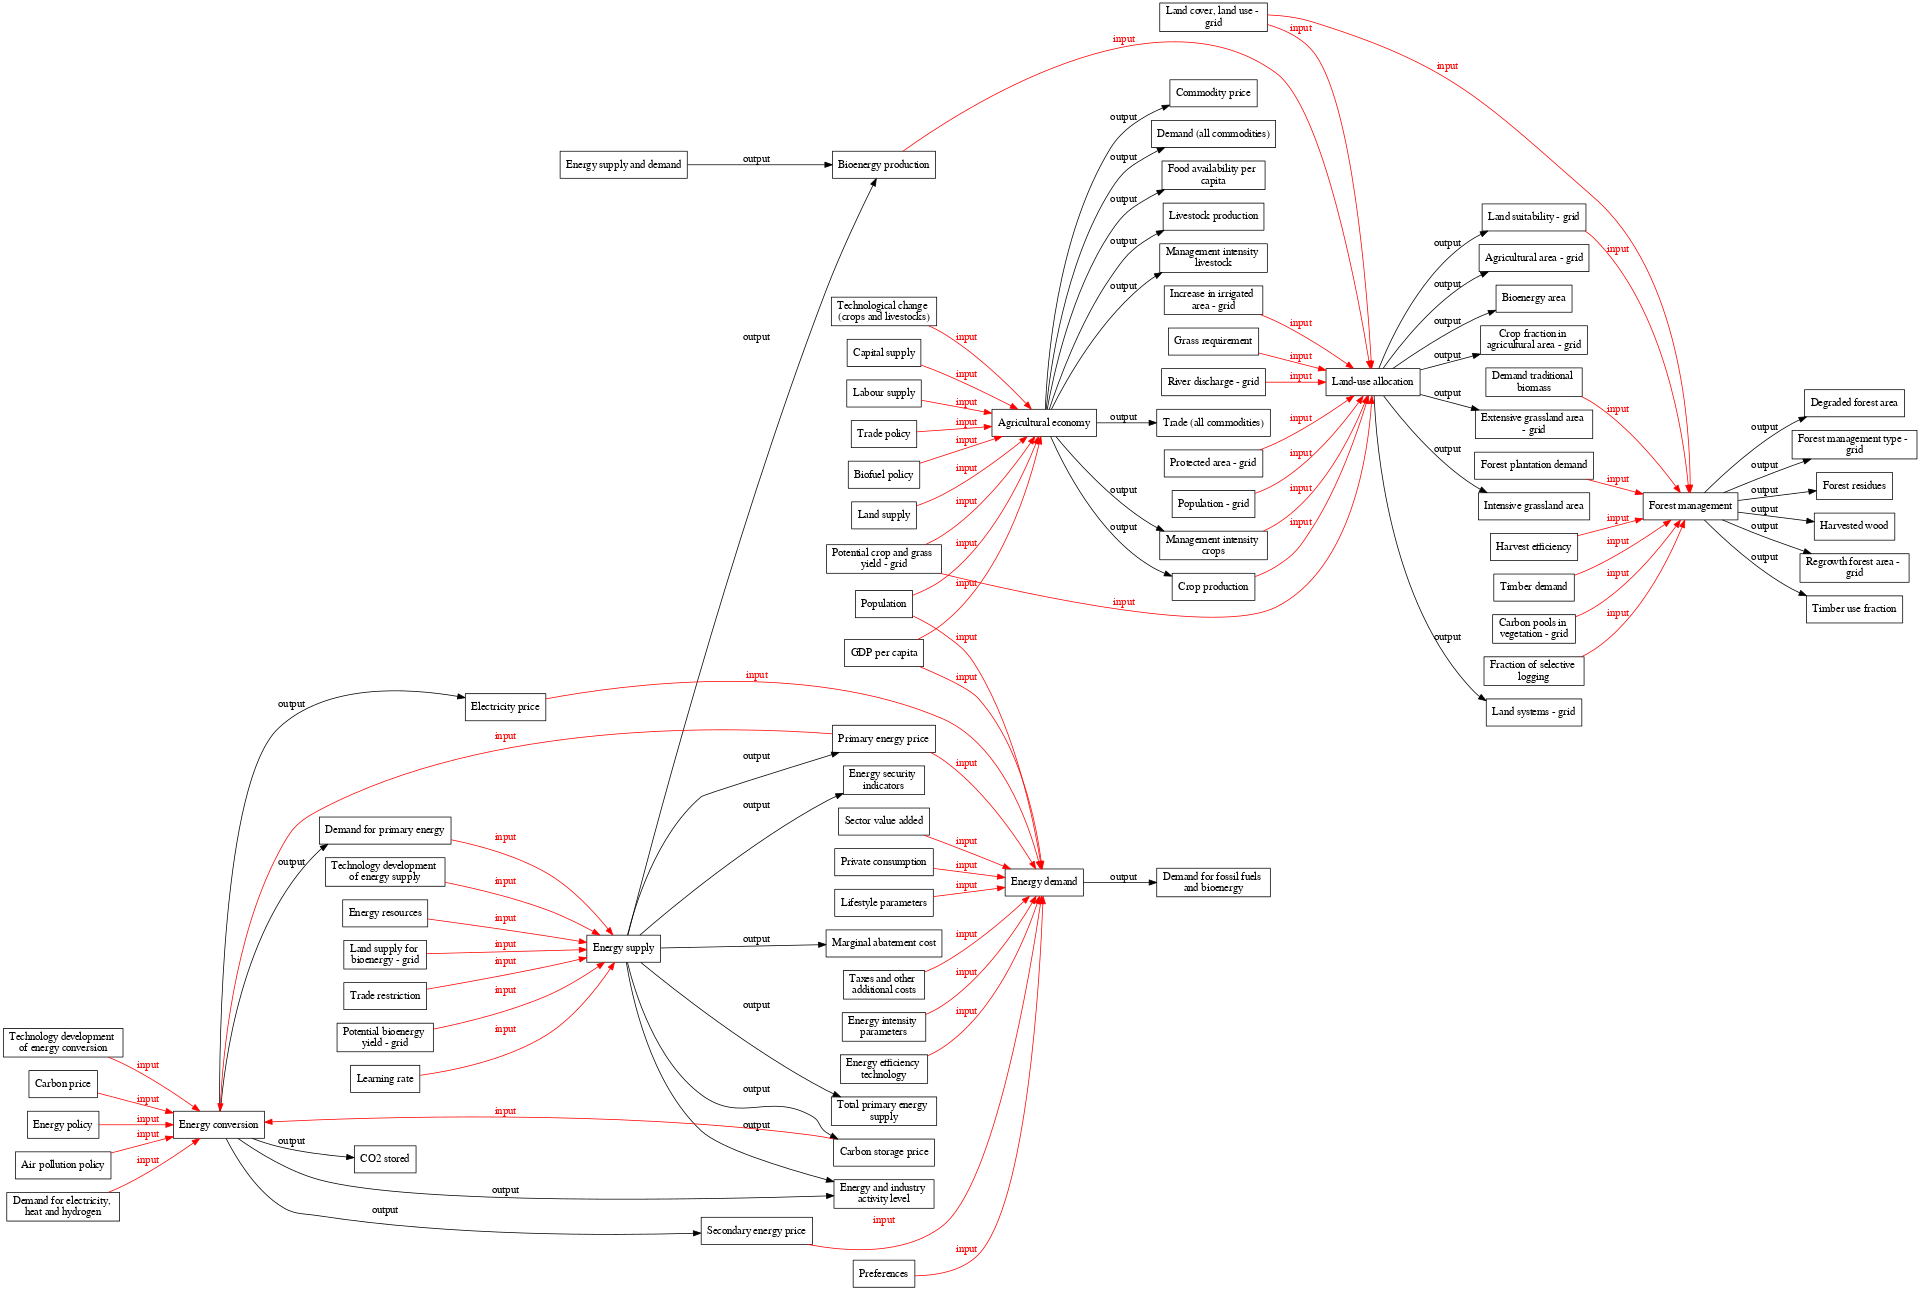
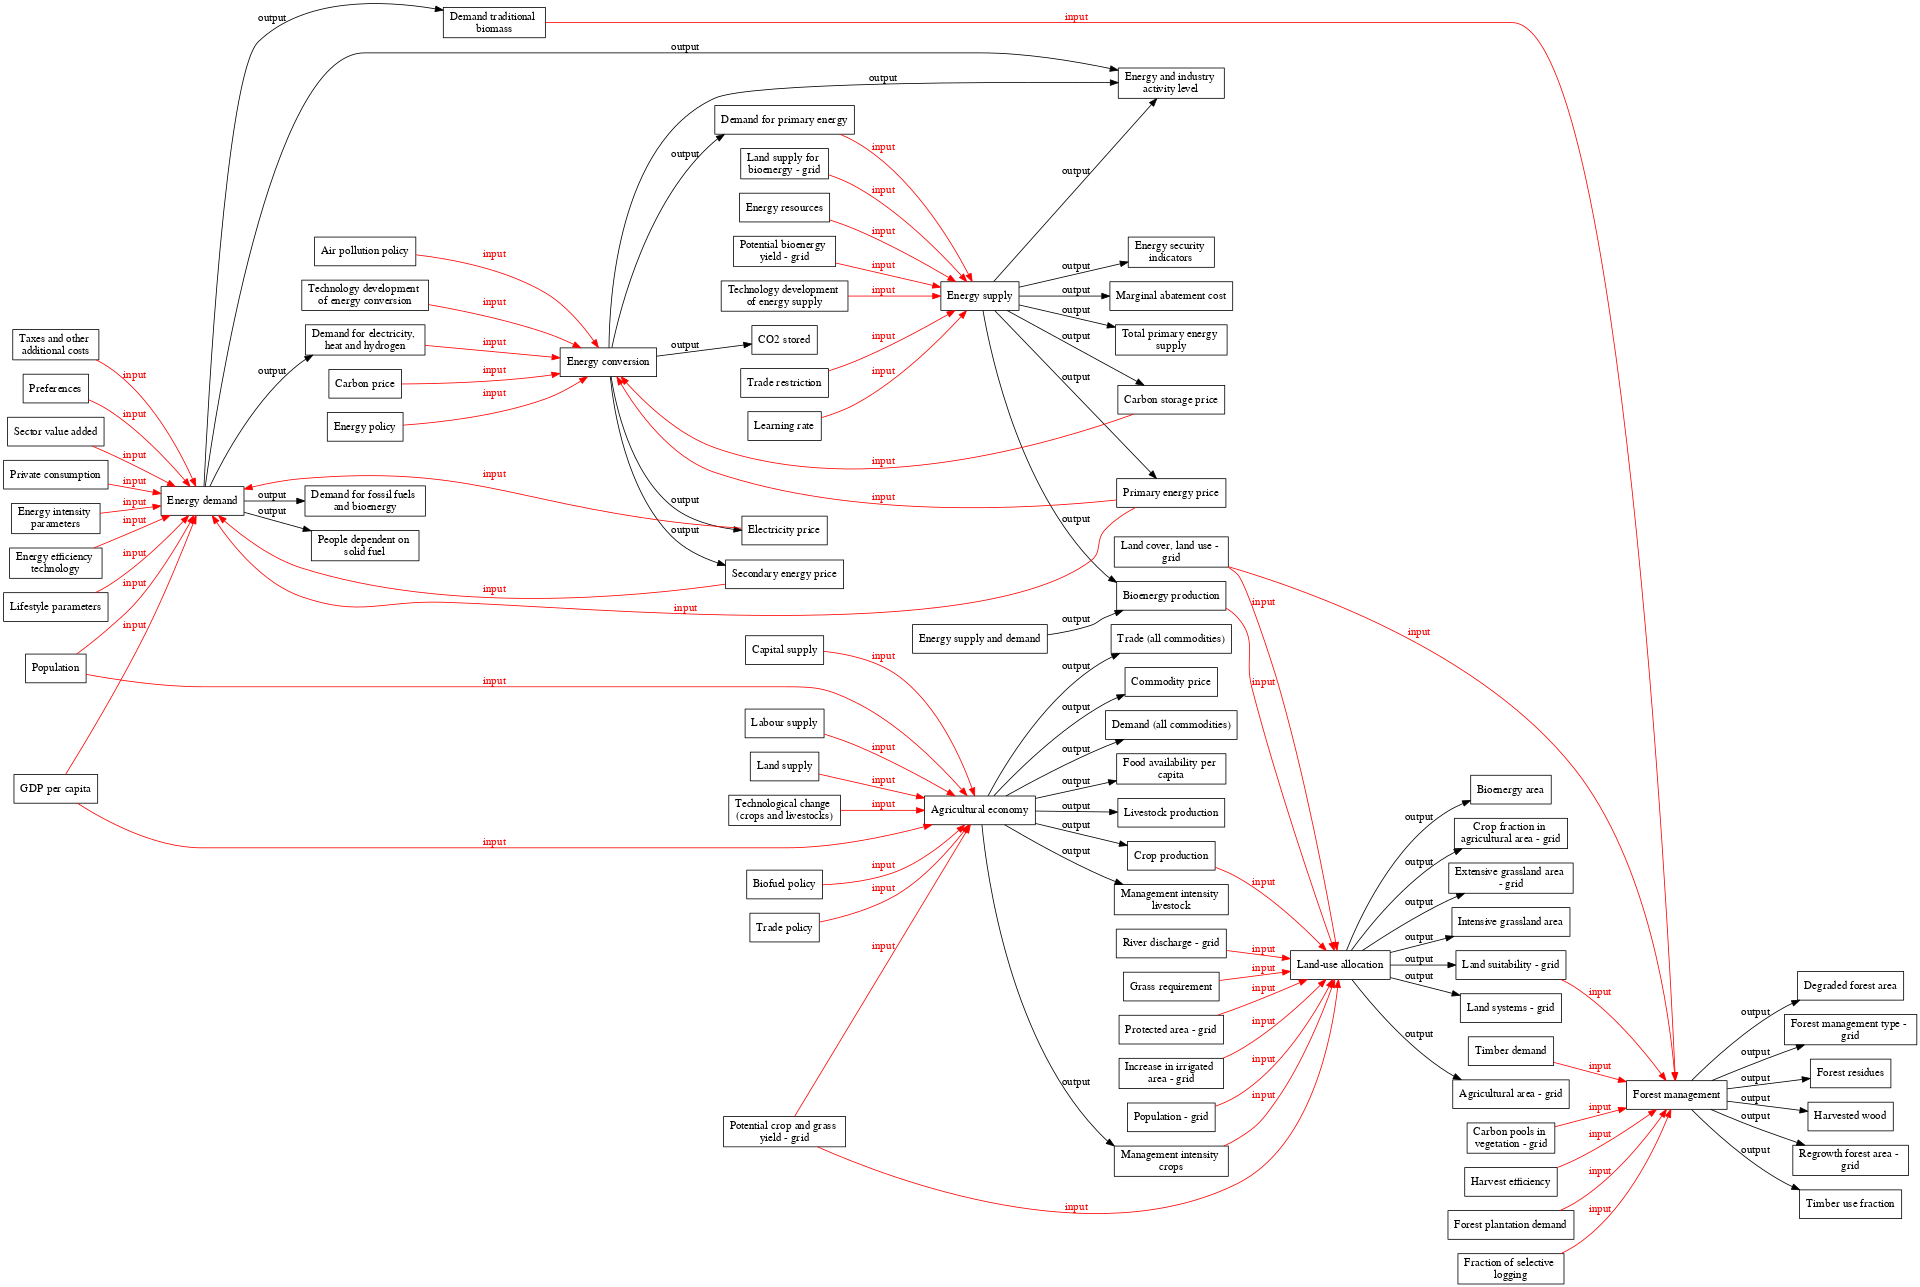
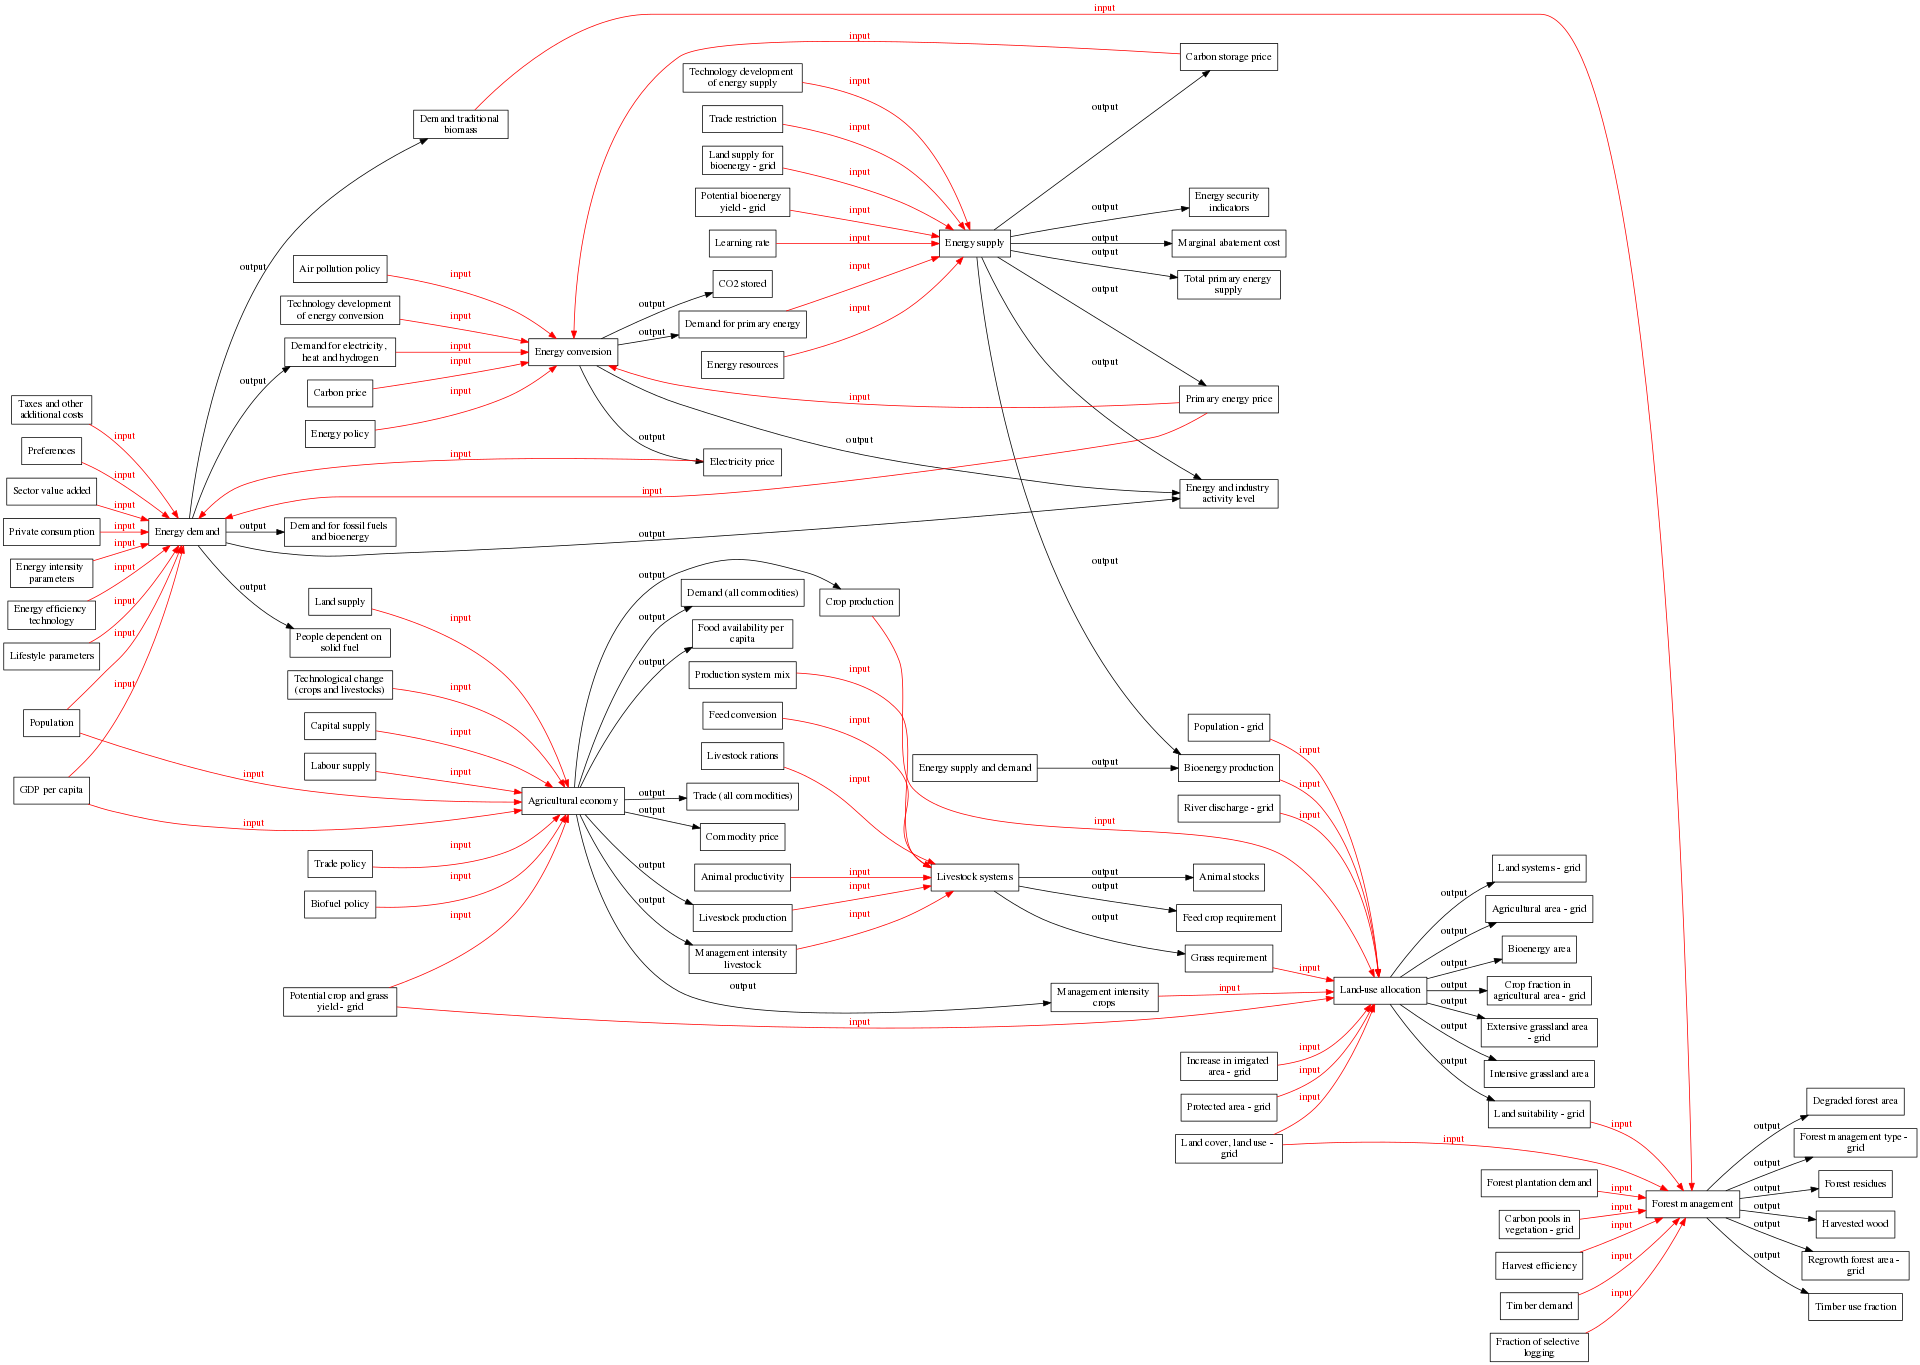
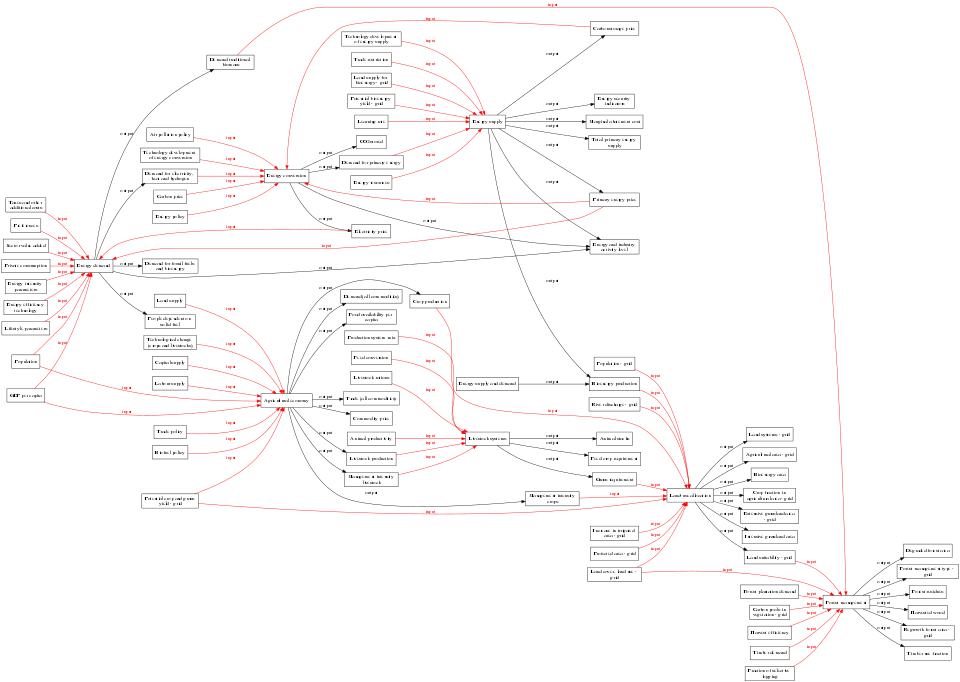
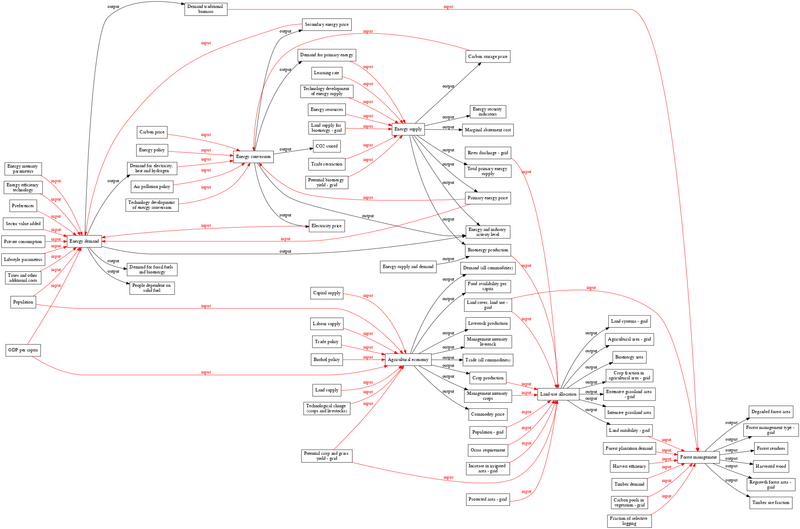
<imagemap>
File:Dataflow_overview___pressure_components_digraph_pressure_components_dot.png
rect 743 448 796 461 [[Agricultural area - grid]]
rect 667 489 713 502 [[Land-use allocation]]
rect 751 468 788 481 [[Bioenergy area]]
rect 744 488 796 502 [[Crop fraction in agricultural area - grid]]
rect 741 509 799 523 [[Extensive grassland area - grid]]
rect 742 530 797 544 [[Intensive grassland area]]
rect 744 550 795 564 [[Land suitability - grid]]
rect 746 428 793 441 [[Land systems - grid]]
rect 261 394 312 407 [[Agricultural economy]]
rect 350 412 393 425 [[Commodity price]]
rect 410 295 450 308 [[Crop production]]
rect 341 290 402 303 [[Demand (all commodities)]]
rect 346 310 396 324 [[Food availability per capita]]
rect 347 452 396 466 [[Livestock production]]
rect 526 492 579 506 [[Management intensity crops]]
rect 345 473 398 487 [[Management intensity livestock]]
rect 343 392 399 405 [[Trade (all commodities)]]
rect 12 355 40 368 [[Population]]
rect 74 259 113 273 [[Energy demand]]
rect 7 389 45 402 [[GDP per capita]]
rect 152 356 188 370 [[Capital supply]]
rect 152 377 188 390 [[Labour supply]]
rect 154 425 186 439 [[Trade policy]]
rect 152 446 188 459 [[Biofuel policy]]
rect 154 294 186 308 [[Land supply]]
rect 142 494 198 508 [[Potential crop and grass yield - grid]]
rect 144 335 196 350 [[Technological change (crops and livestocks)]]
rect 597 432 632 446 [[Animal stocks]]
rect 466 432 509 446 [[Livestock systems]]
rect 588 452 641 466 [[Feed crop requirement]]
rect 593 473 636 486 [[Grass requirement]]
rect 589 377 640 391 [[Bioenergy production]]
rect 470 115 505 129 [[Energy supply]]
rect 590 22 639 35 [[Carbon storage price]]
rect 590 240 639 254 [[Energy and industry activity level]]
rect 595 94 634 108 [[Energy security indicators]]
rect 586 115 643 129 [[Marginal abatement cost]]
rect 590 193 639 206 [[Primary energy price]]
rect 589 135 640 150 [[Total primary energy supply]]
rect 456 377 519 391 [[Energy supply and demand]]
rect 357 135 386 149 [[CO2 stored]]
rect 264 169 309 183 [[Energy conversion]]
rect 339 156 403 169 [[Demand for primary energy]]
rect 352 224 391 238 [[Electricity price]]
rect 903 544 952 558 [[Degraded forest area]]
rect 823 595 870 609 [[Forest management]]
rect 897 564 959 579 [[Forest management type - grid]]
rect 909 585 946 599 [[Forest residues]]
rect 908 606 947 619 [[Harvested wood]]
rect 901 626 955 640 [[Regrowth forest area - grid]]
rect 904 647 951 660 [[Timber use fraction]]
rect 142 169 198 183 [[Demand for electricity  heat and hydrogen]]
rect 142 259 198 273 [[Demand for fossil fuels and bioenergy]]
rect 207 55 254 69 [[Demand traditional biomass]]
rect 145 314 195 329 [[People dependent on solid fuel]]
rect 154 190 186 203 [[Carbon price]]
rect 153 210 188 224 [[Energy policy]]
rect 147 128 194 141 [[Air pollution policy]]
rect 140 148 200 162 [[Technology development of energy conversion]]
rect 3 239 48 253 [[Sector value added]]
rect 2 259 50 273 [[Private consumption]]
rect 5 280 46 294 [[Energy intensity parameters]]
rect 4 301 48 315 [[Energy efficiency technology]]
rect 2 321 50 335 [[Lifestyle parameters]]
rect 6 198 46 212 [[Taxes and other additional costs]]
rect 11 219 41 232 [[Preferences]]
rect 351 176 392 189 [[Energy resources]]
rect 342 32 401 46 [[Technology development of energy supply]]
rect 351 53 391 66 [[Trade restriction]]
rect 351 73 391 87 [[Land supply for bioenergy - grid]]
rect 348 94 395 108 [[Potential bioenergy yield - grid]]
rect 355 115 388 129 [[Learning rate]]
rect 588 567 641 582 [[Land cover  land use - grid]]
rect 741 585 799 598 [[Forest plantation demand]]
rect 750 605 790 619 [[Carbon pools in vegetation - grid]]
rect 748 626 791 640 [[Harvest efficiency]]
rect 750 646 789 660 [[Timber demand]]
rect 745 667 794 681 [[Fraction of selective logging]]
rect 590 526 639 540 [[Increase in irrigated area - grid]]
rect 591 547 639 561 [[Protected area - grid]]
rect 594 357 635 371 [[Population - grid]]
rect 589 398 640 411 [[River discharge - grid]]
rect 345 331 398 344 [[Production system mix]]
rect 351 351 391 365 [[Feed conversion]]
rect 351 371 392 385 [[Livestock rations]]
rect 347 432 395 446 [[Animal productivity]]</imagemap>
See ImageMap for more information.
File history
Click on a date/time to view the file as it appeared at that time.


You cannot overwrite this file.
File usage
The following page uses this file: