File:Dataflow overview response components digraph response components dot.png
Jump to navigation
Jump to search
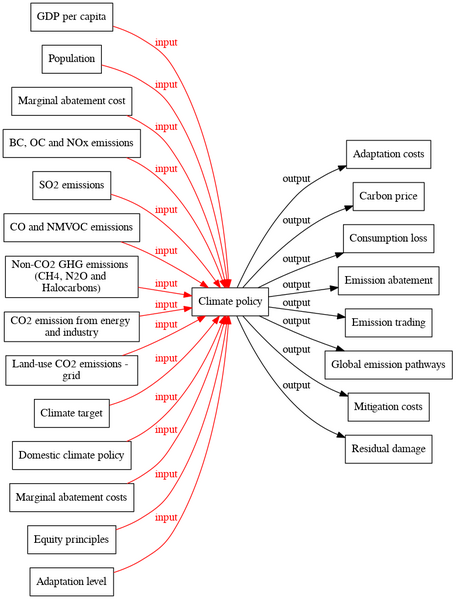
Size of this preview: 456 × 599 pixels. Other resolution: 779 × 1,024 pixels.
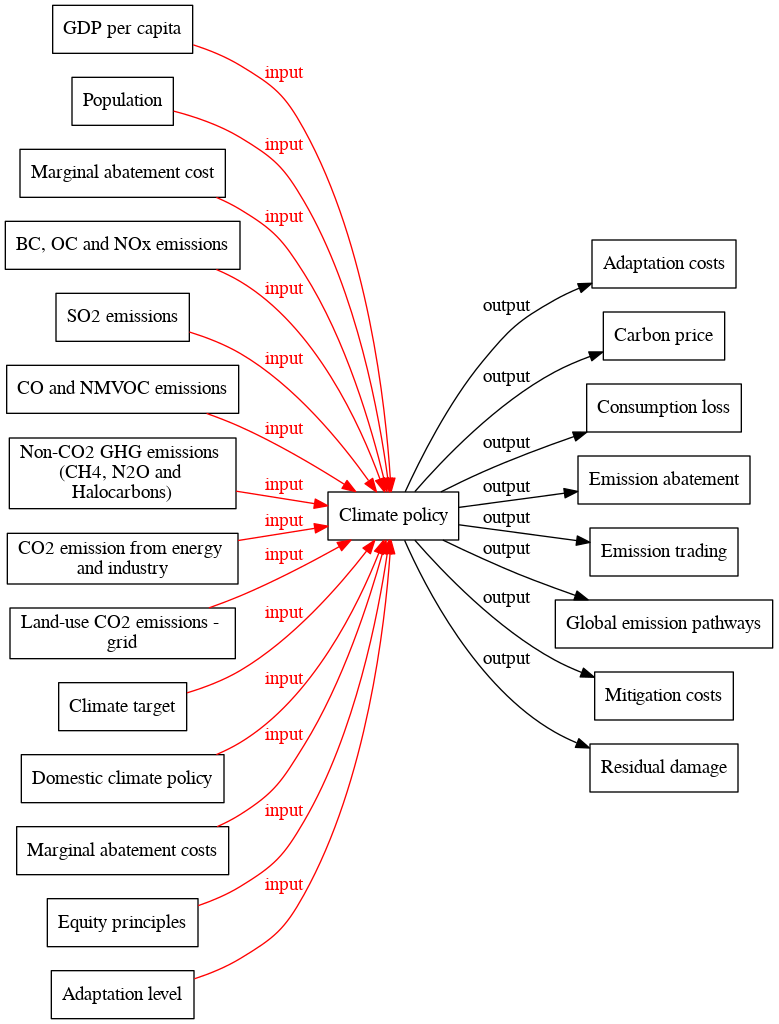
Original file (779 × 1,024 pixels, file size: 127 KB, MIME type: image/png)
ImageMap
When including this image in a wiki page, use the following mark-up to enable links:
<imagemap>
File:Dataflow_overview___response_components_digraph_response_components_dot.png
rect 583 221 726 269 [[Adaptation costs]]
rect 320 473 451 521 [[Climate policy]]
rect 597 293 713 341 [[Carbon price]]
rect 578 365 731 413 [[Consumption loss]]
rect 569 437 740 485 [[Emission abatement]]
rect 581 509 728 557 [[Emission trading]]
rect 547 581 762 629 [[Global emission pathways]]
rect 585 653 725 701 [[Mitigation costs]]
rect 581 725 728 773 [[Residual damage]]
rect 70 5 170 53 [[Population]]
rect 53 77 187 125 [[GDP per capita]]
rect 6 149 234 197 [[CO and NMVOC emissions]]
rect 19 221 221 269 [[Marginal abatement cost]]
rect 57 293 183 341 [[Climate target]]
rect 19 365 221 413 [[Domestic climate policy]]
rect 47 437 193 485 [[Equity principles]]
rect 49 509 191 557 [[Adaptation level]]
rect 7 581 233 632 [[CO2 emission from energy and industry]]
rect 11 657 229 727 [[Non-CO2 GHG emissions (CH4  N2O and Halocarbons)]]
rect 5 752 235 800 [[BC  OC and NOx emissions]]
rect 55 824 185 872 [[SO2 emissions]]
rect 9 896 231 947 [[Land-use CO2 emissions - grid]]
rect 15 971 225 1019 [[Marginal abatement costs]]</imagemap>
See ImageMap for more information.
File history
Click on a date/time to view the file as it appeared at that time.
| Date/Time | Thumbnail | Dimensions | User | Comment | |
|---|---|---|---|---|---|
| current | 11:09, 23 March 2020 | | 779 × 1,024 (127 KB) | Oostenrijr (talk | contribs) | |
| 16:46, 20 March 2020 |  | 779 × 1,024 (127 KB) | Graphviz (talk | contribs) | ||
| 14:56, 20 March 2020 |  | 733 × 1,024 (98 KB) | Graphviz (talk | contribs) | ||
| 14:58, 10 March 2020 |  | 779 × 1,024 (123 KB) | Oostenrijr (talk | contribs) | ||
| 10:50, 19 July 2017 |  | 768 × 1,024 (116 KB) | Oostenrijr (talk | contribs) | generated by the GraphViz extension from the Dataflow overview - response components page | |
| 10:50, 19 July 2017 | 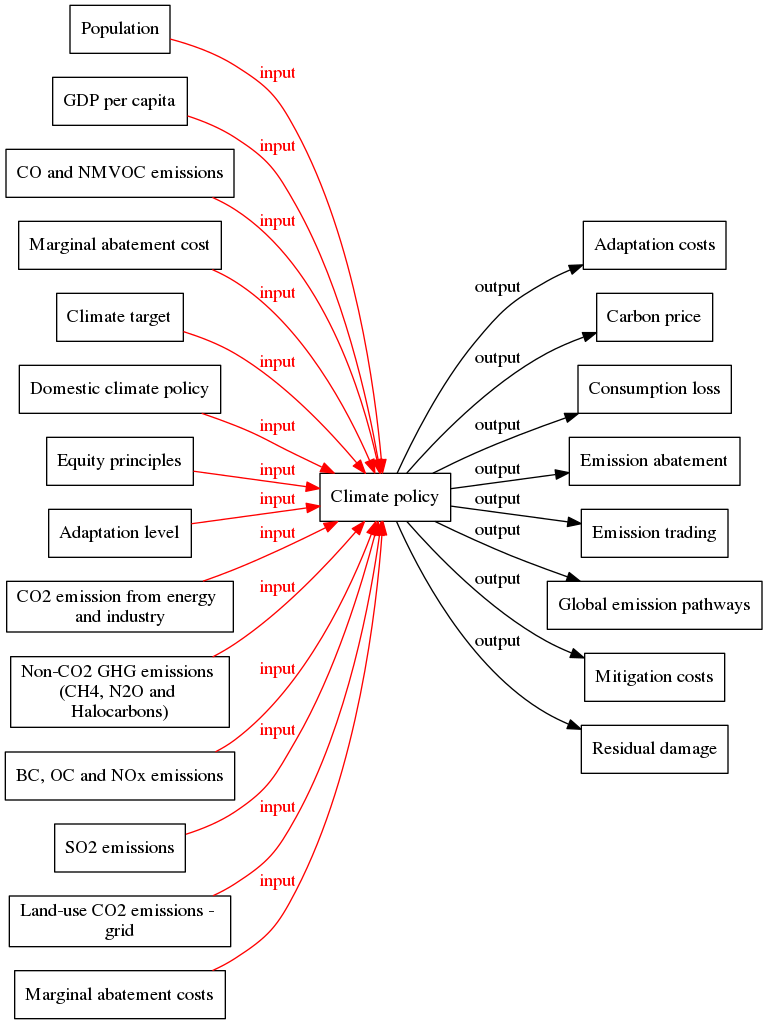 | 768 × 1,024 (116 KB) | Oostenrijr (talk | contribs) | generated by the GraphViz extension from the Dataflow overview - response components page |
You cannot overwrite this file.
File usage
The following page uses this file: