File:Dataflow overview state components digraph state components dot.png
Jump to navigation
Jump to search
Size of this preview: 779 × 599 pixels. Other resolution: 1,920 × 1,477 pixels.
Original file (1,920 × 1,477 pixels, file size: 343 KB, MIME type: image/png)
ImageMap
When including this image in a wiki page, use the following mark-up to enable links:
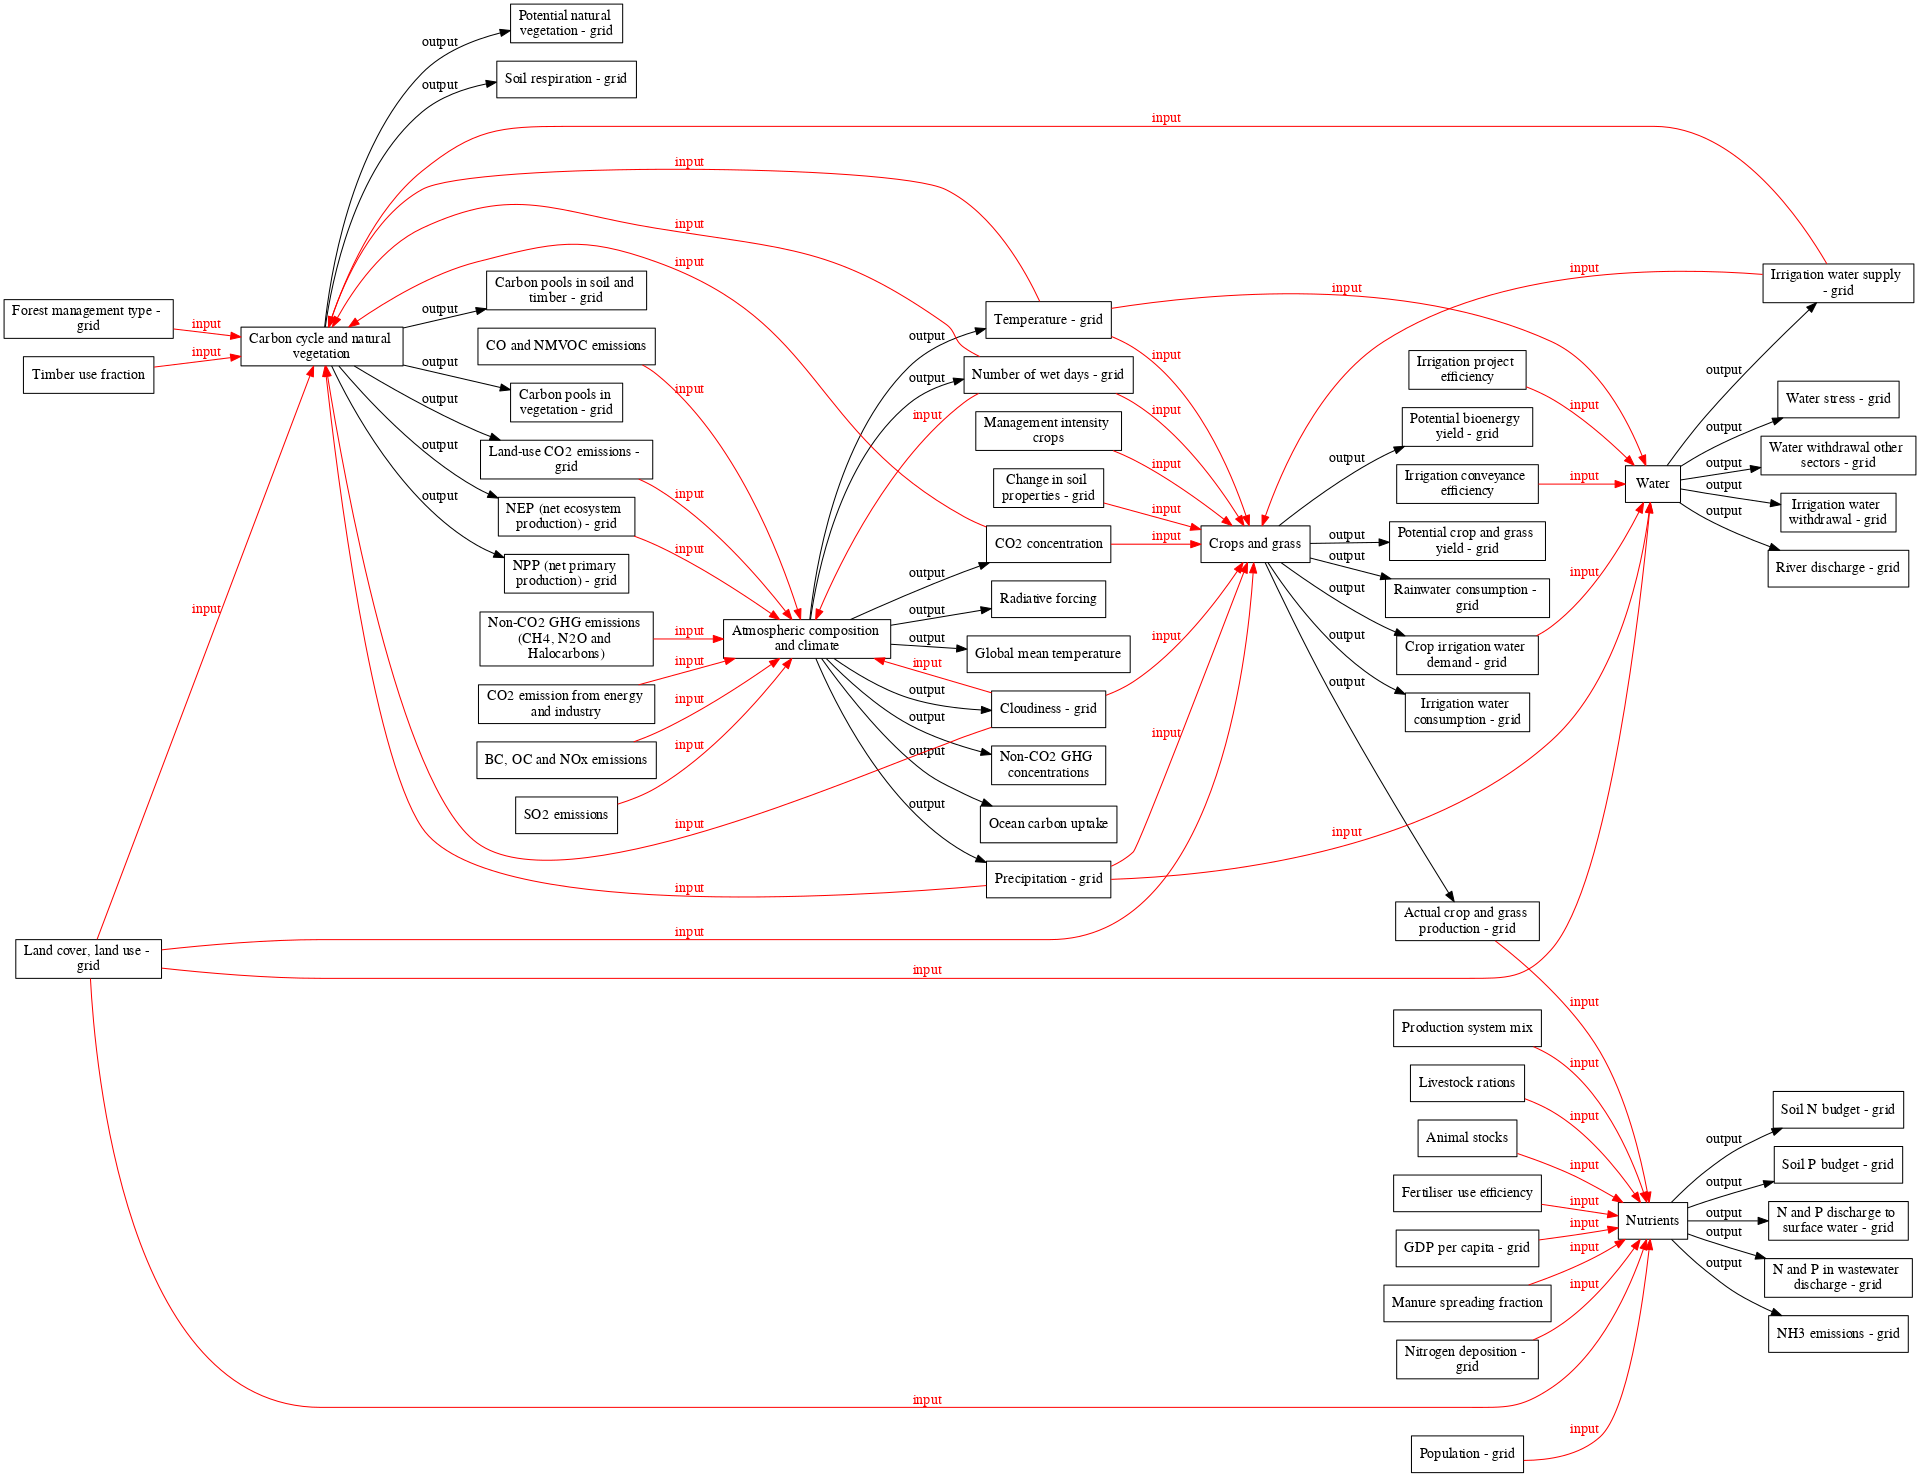
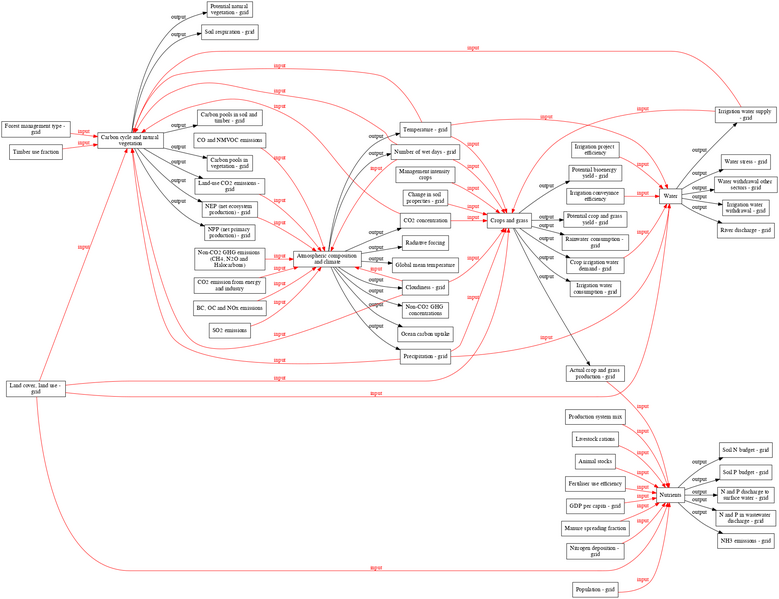
<imagemap>
File:Dataflow_overview___state_components_digraph_state_components_dot.png
rect 1398 4 1542 44 [[Actual crop and grass production - grid]]
rect 1621 317 1691 354 [[Nutrients]]
rect 1203 572 1311 610 [[Crops and grass]]
rect 1400 571 1540 611 [[Crop irrigation water demand - grid]]
rect 1407 630 1533 669 [[Irrigation water consumption - grid]]
rect 1405 688 1536 727 [[Potential bioenergy yield - grid]]
rect 1392 746 1549 785 [[Potential crop and grass yield - grid]]
rect 1388 62 1552 102 [[Rainwater consumption - grid]]
rect 725 399 894 438 [[Atmospheric composition and climate]]
rect 991 630 1114 667 [[CO2 concentration]]
rect 995 457 1110 495 [[Cloudiness - grid]]
rect 971 287 1134 324 [[Global mean temperature]]
rect 997 343 1108 382 [[Non-CO2 GHG concentrations]]
rect 968 686 1137 723 [[Number of wet days - grid]]
rect 984 401 1121 438 [[Ocean carbon uptake]]
rect 991 742 1114 779 [[Precipitation - grid]]
rect 995 231 1110 268 [[Radiative forcing]]
rect 990 175 1115 212 [[Temperature - grid]]
rect 501 407 637 447 [[NEP (net ecosystem production) - grid]]
rect 242 630 405 669 [[Carbon cycle and natural vegetation]]
rect 518 524 620 561 [[SO2 emissions]]
rect 481 162 658 199 [[CO and NMVOC emissions]]
rect 480 218 659 256 [[BC  OC and NOx emissions]]
rect 484 275 655 330 [[Non-CO2 GHG emissions (CH4  N2O and Halocarbons)]]
rect 481 349 658 389 [[CO2 emission from energy and industry]]
rect 483 465 656 505 [[Land-use CO2 emissions - grid]]
rect 489 852 649 891 [[Carbon pools in soil and timber - grid]]
rect 514 910 625 950 [[Carbon pools in vegetation - grid]]
rect 509 104 630 143 [[NPP (net primary production) - grid]]
rect 512 698 626 738 [[Potential natural vegetation - grid]]
rect 500 756 639 794 [[Soil respiration - grid]]
rect 24 603 154 640 [[Timber use fraction]]
rect 15 959 164 998 [[Land cover  land use - grid]]
rect 14 296 165 336 [[Irrigation water supply - grid]]
rect 4 659 175 698 [[Forest management type - grid]]
rect 998 513 1106 553 [[Change in soil properties - grid]]
rect 978 571 1127 611 [[Management intensity crops]]
rect 1771 201 1911 240 [[N and P discharge to surface water - grid]]
rect 1767 259 1915 298 [[N and P in wastewater discharge - grid]]
rect 1771 317 1911 354 [[NH3 emissions - grid]]
rect 1776 373 1906 410 [[Soil N budget - grid]]
rect 1777 429 1905 466 [[Soil P budget - grid]]
rect 1414 121 1527 158 [[Population - grid]]
rect 1401 177 1540 214 [[GDP per capita - grid]]
rect 1421 233 1519 270 [[Animal stocks]]
rect 1413 289 1527 326 [[Livestock rations]]
rect 1386 345 1554 382 [[Manure spreading fraction]]
rect 1399 401 1541 441 [[Nitrogen deposition - grid]]
rect 1396 459 1544 497 [[Production system mix]]
rect 1395 515 1545 553 [[Fertiliser use efficiency]]</imagemap>
See ImageMap for more information.
File history
Click on a date/time to view the file as it appeared at that time.
| Date/Time | Thumbnail | Dimensions | User | Comment | |
|---|---|---|---|---|---|
| current | 09:19, 14 June 2021 | | 1,920 × 1,477 (343 KB) | Dafnomilii (talk | contribs) | |
| 11:08, 23 March 2020 |  | 1,920 × 1,477 (343 KB) | Oostenrijr (talk | contribs) | ||
| 16:46, 20 March 2020 |  | 1,920 × 1,477 (343 KB) | Graphviz (talk | contribs) | ||
| 14:56, 20 March 2020 | 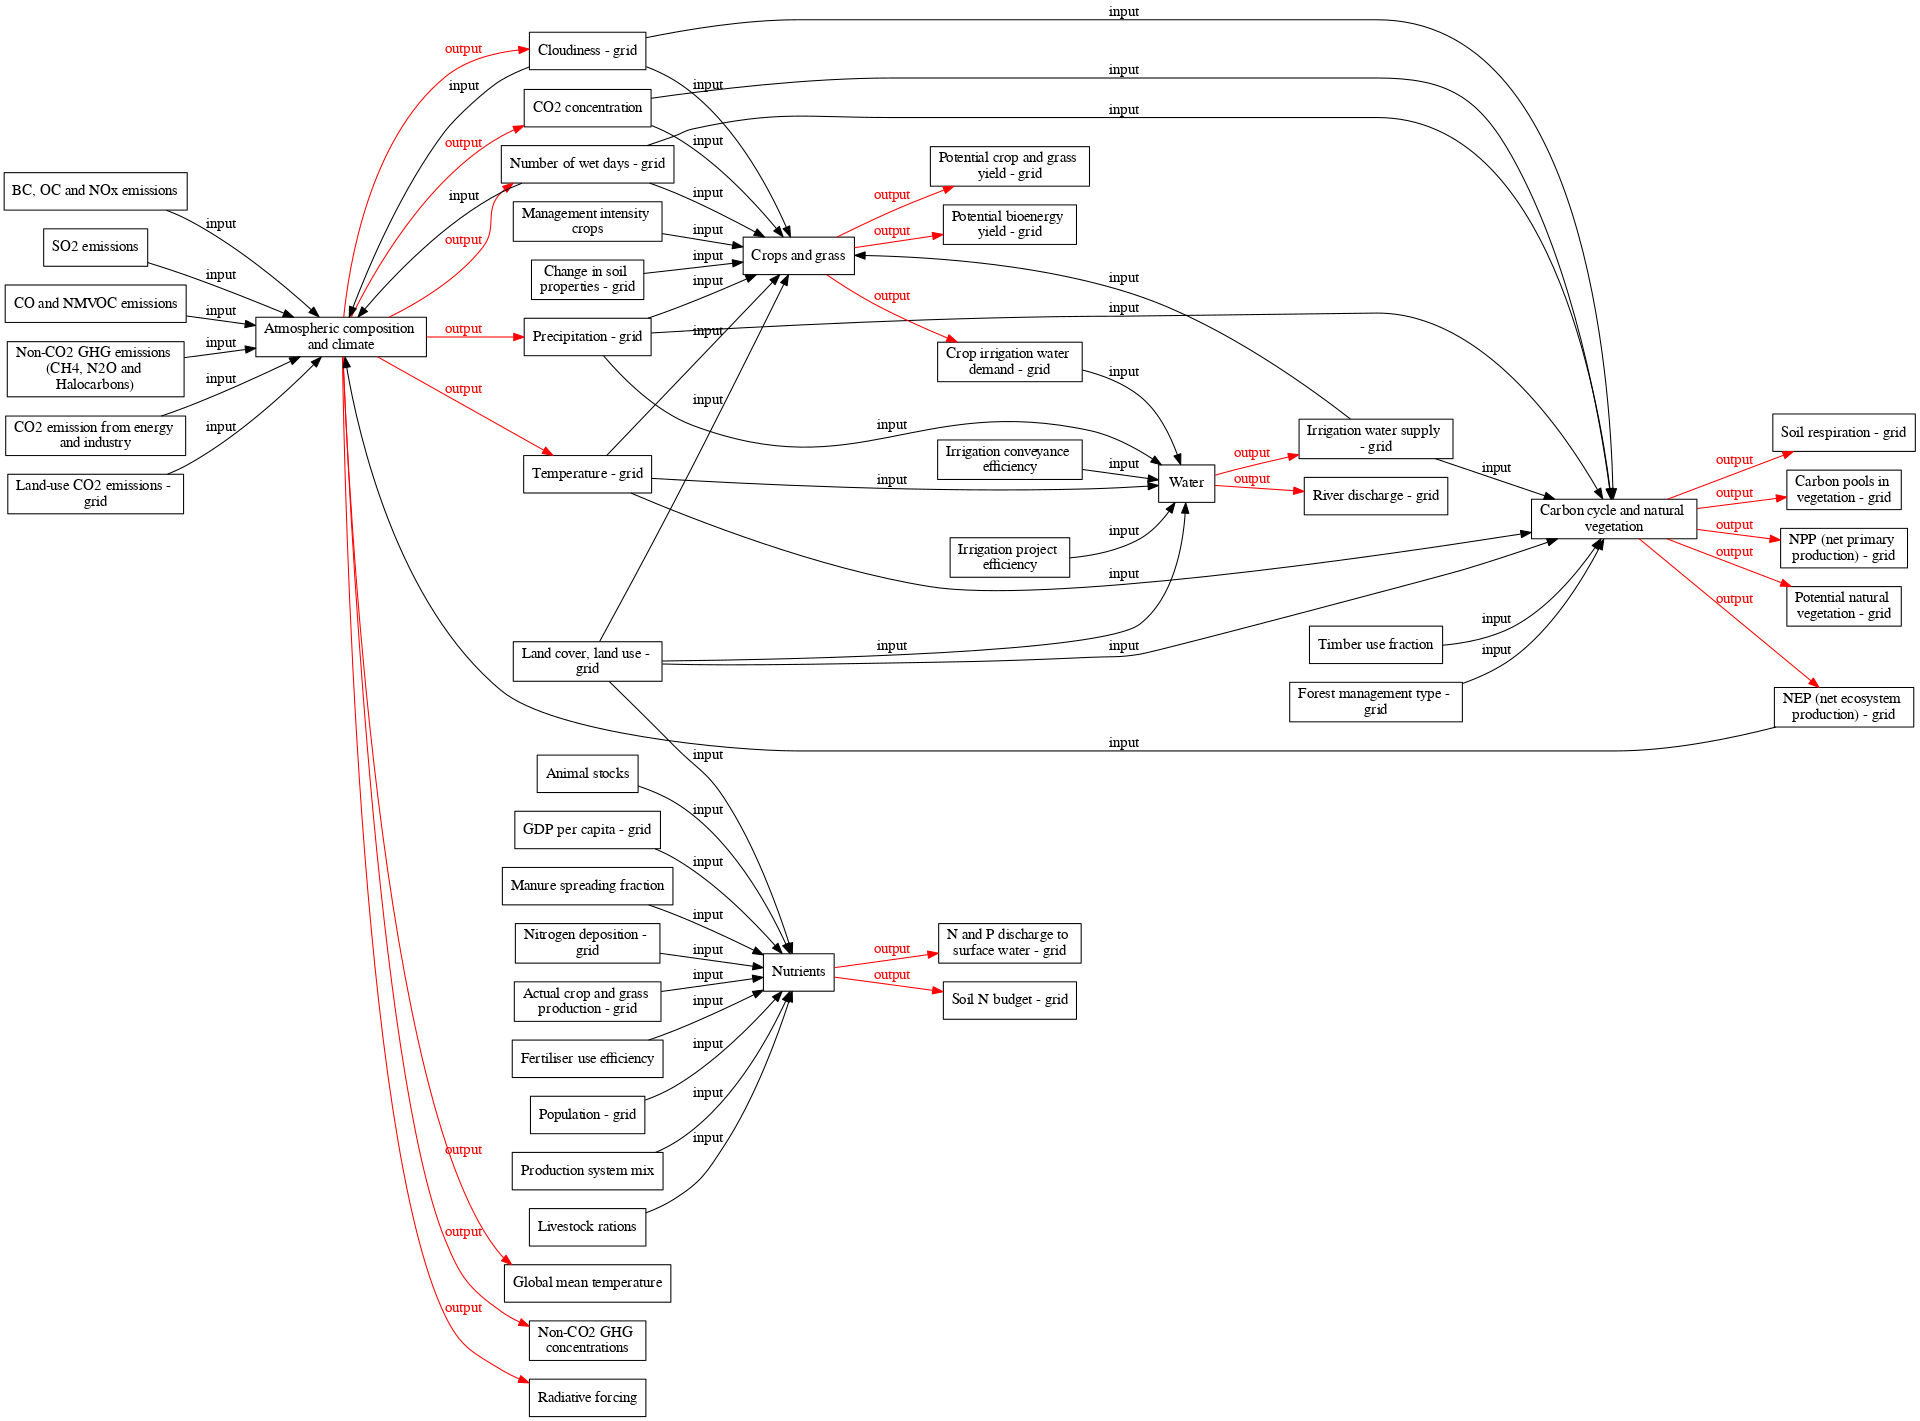 | 1,920 × 1,421 (304 KB) | Graphviz (talk | contribs) | ||
| 11:53, 19 March 2020 | 423 × 1,920 (182 KB) | Oostenrijr (talk | contribs) | |||
| 10:51, 19 July 2017 | 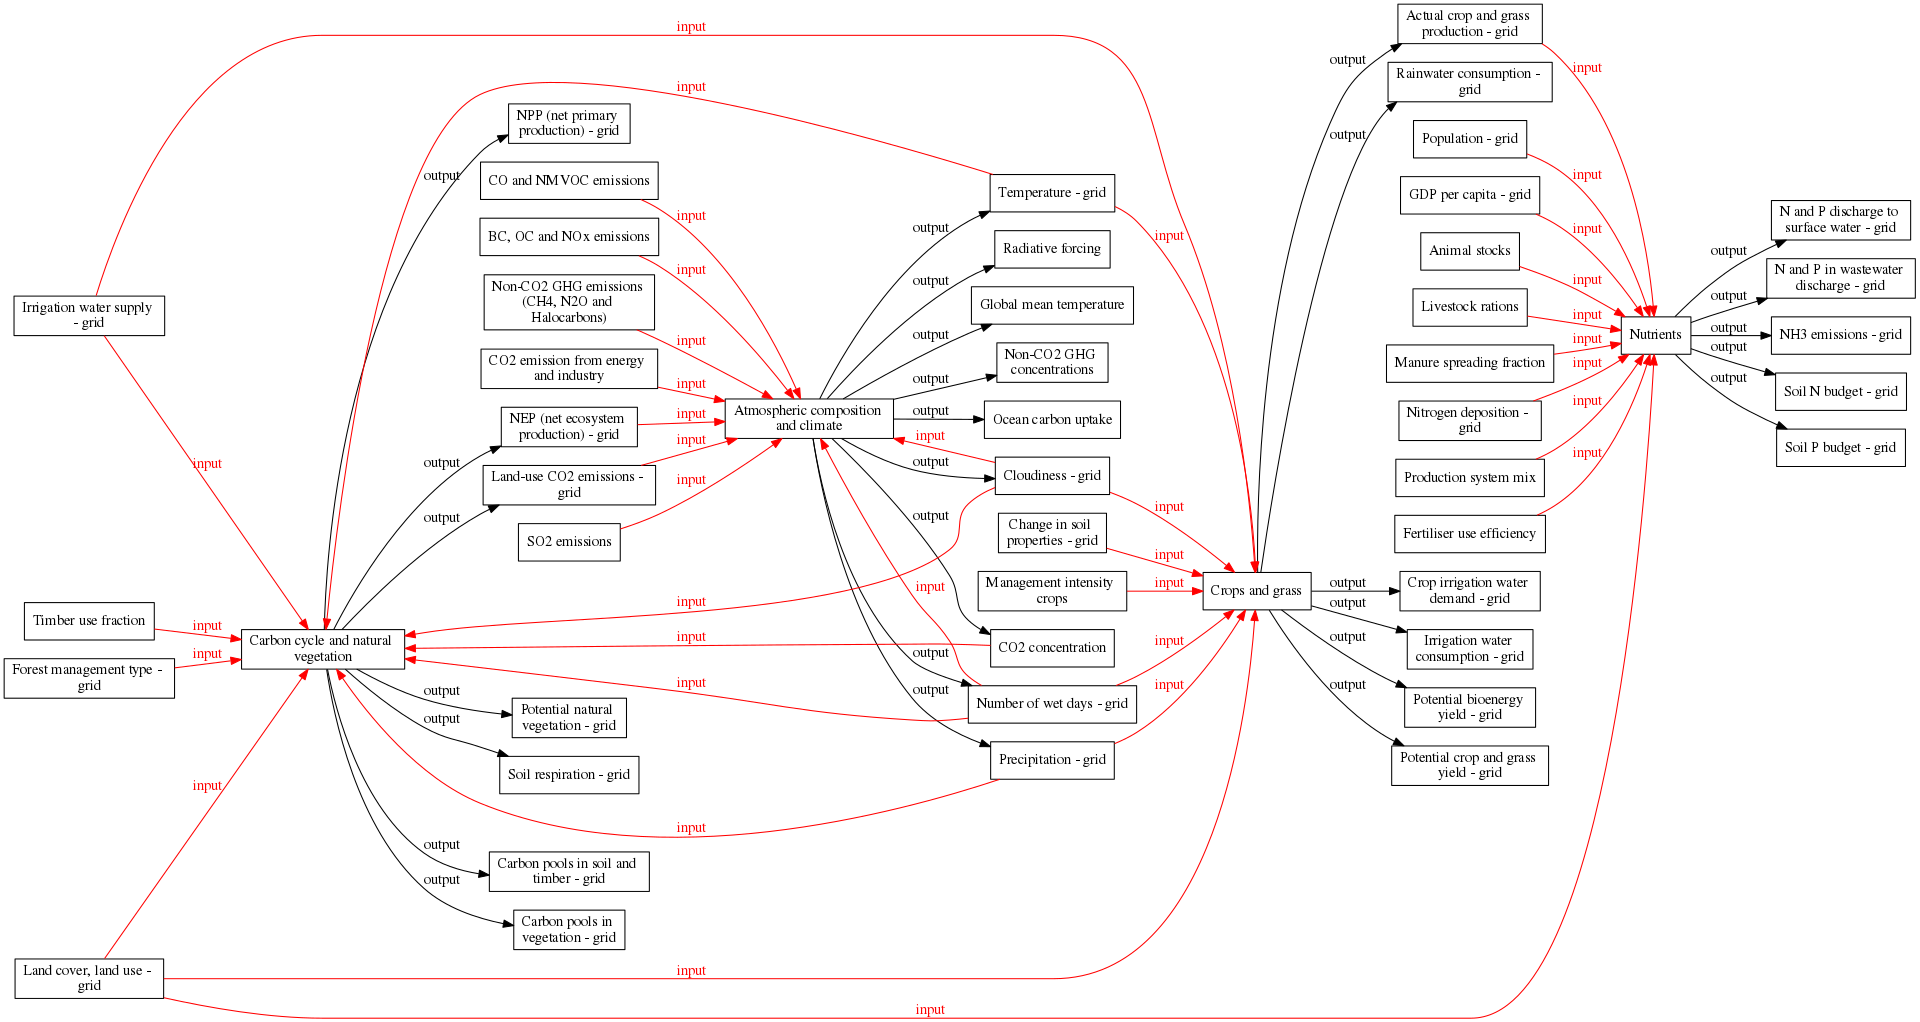 | 1,920 × 1,022 (285 KB) | Oostenrijr (talk | contribs) | generated by the GraphViz extension from the Dataflow overview - state components page | |
| 10:51, 19 July 2017 |  | 1,920 × 1,022 (285 KB) | Oostenrijr (talk | contribs) | generated by the GraphViz extension from the Dataflow overview - state components page |
You cannot overwrite this file.
File usage
The following page uses this file: