File:GDP per capita digraph inputvariable dot.png
Jump to navigation
Jump to search
Size of this preview: 800 × 130 pixels. Other resolution: 864 × 140 pixels.
Original file (864 × 140 pixels, file size: 15 KB, MIME type: image/png)
ImageMap
When including this image in a wiki page, use the following mark-up to enable links:
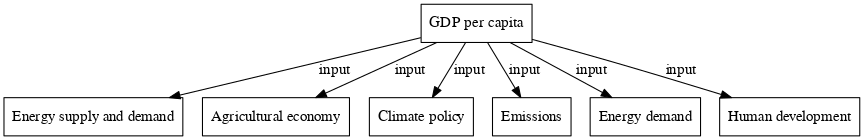
<imagemap>
File:GDP_per_capita_digraph_inputvariable_dot.png
rect 337 4 444 43 [[GDP per capita]]
rect 4 98 150 137 [[Agricultural economy]]
rect 170 98 275 137 [[Climate policy]]
rect 295 98 373 137 [[Emissions]]
rect 392 98 502 137 [[Energy demand]]
rect 522 98 700 137 [[Energy supply and demand]]
rect 720 98 860 137 [[Human development]]</imagemap>
See ImageMap for more information.
File history
Click on a date/time to view the file as it appeared at that time.
| Date/Time | Thumbnail | Dimensions | User | Comment | |
|---|---|---|---|---|---|
| current | 09:19, 14 June 2021 | 864 × 140 (15 KB) | Dafnomilii (talk | contribs) | ||
| 10:56, 23 March 2020 | 800 × 176 (15 KB) | Oostenrijr (talk | contribs) | |||
| 15:35, 20 March 2020 | 864 × 140 (15 KB) | Graphviz (talk | contribs) | |||
| 14:53, 20 March 2020 | 149 × 59 (2 KB) | Graphviz (talk | contribs) | |||
| 16:43, 19 March 2020 | 864 × 165 (16 KB) | Oostenrijr (talk | contribs) | |||
| 16:43, 19 March 2020 | 149 × 59 (2 KB) | Oostenrijr (talk | contribs) | |||
| 19:00, 10 March 2020 |  | 213 × 259 (9 KB) | Oostenrijr (talk | contribs) | ||
| 11:00, 19 July 2017 | 864 × 141 (16 KB) | Oostenrijr (talk | contribs) | generated by the GraphViz extension from the GDP per capita page |
You cannot overwrite this file.
File usage
There are no pages that use this file.